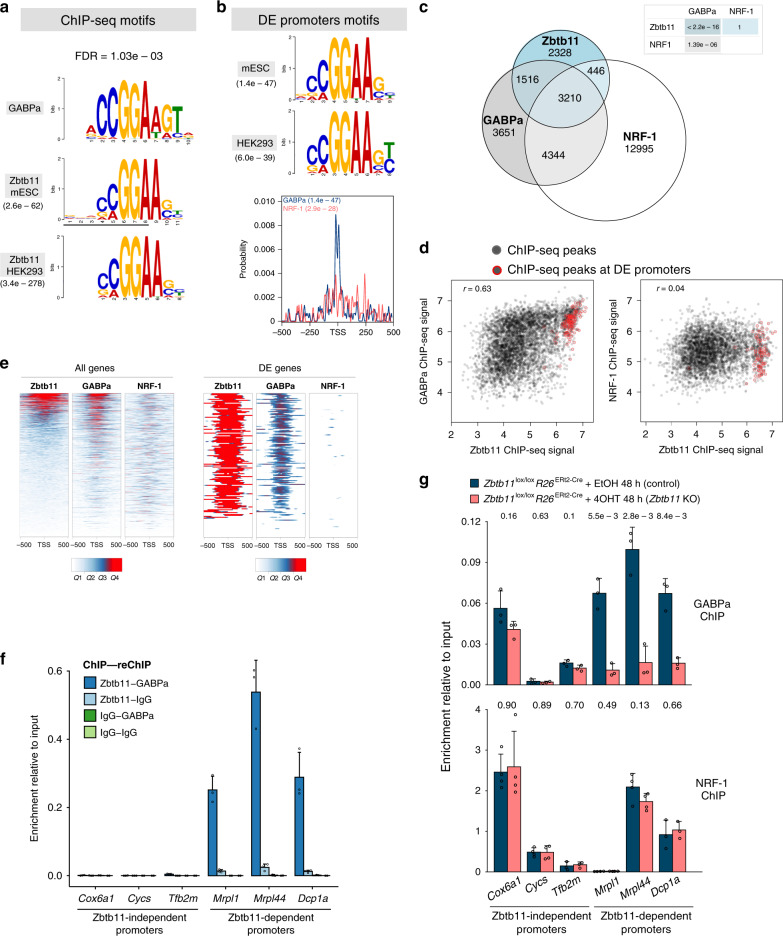
Fig. 4. Zbtb11 controls the locus-specific recruitment of NRF-2.
a Zbtb11 top motifs identified de novo from Zbtb11-high peaks in mESCs and HEK293 cells, respectively (MEME-ChIP E values indicated), aligned to previously determined GABPa motif (upper panel). FDR for the Zbtb11 motif match to GABPa is indicated above. b Top motifs identified de novo from the promoter sequences of Zbtb11-dependent genes in mouse (mESC) and human (HEK293), respectively. Lower panel—the probability distribution for GABPa and NRF-1 motifs in the promoter regions of Zbtb11-dependent genes. Enrichment p values are given for each motif. c Genome-wide overlap between ChIP-seq peaks identified in mouse ES cell for Zbtb11, NRF-1 and GABPa. P values for pairwise hypergeometric tests (see Methods) are shown in the table. d Correlation of ChIP-seq signal (normalised read coverage) at overlapping peaks. Peaks at promoters of Zbtb11-dependent genes are circled in red. e Zbtb11, NRF-1 and GABPa ChIP-seq signal (quantiles of normalised read coverage) at the promoters of all genes expressed in mouse ESCs (left panels, n = 14,362), and at the promoters of Zbtb11-dependent genes (right panels, n = 154). f Sequential ChIP enrichment values at a panel of Zbtb11-dependent and -independent promoters in wild-type mouse ESCs, using the indicated combinations of ChIP and reChIP antibodies (mean and SD of three replicates). Source data are provided as a Source Data file. g GABPa and NRF-1 ChIP enrichment values at a panel of Zbtb11-dependent and -independent promoters, in control and Zbtb11 KO cells. Bars represent means and standard deviations of n = 3 (GABPa) and n = 4 (NRF-1) independent experiments (shown as open circles). P values for two-tailed t tests comparing control to Zbtb11 KO samples are shown above each binding site. Source data are provided as a Source Data file.

