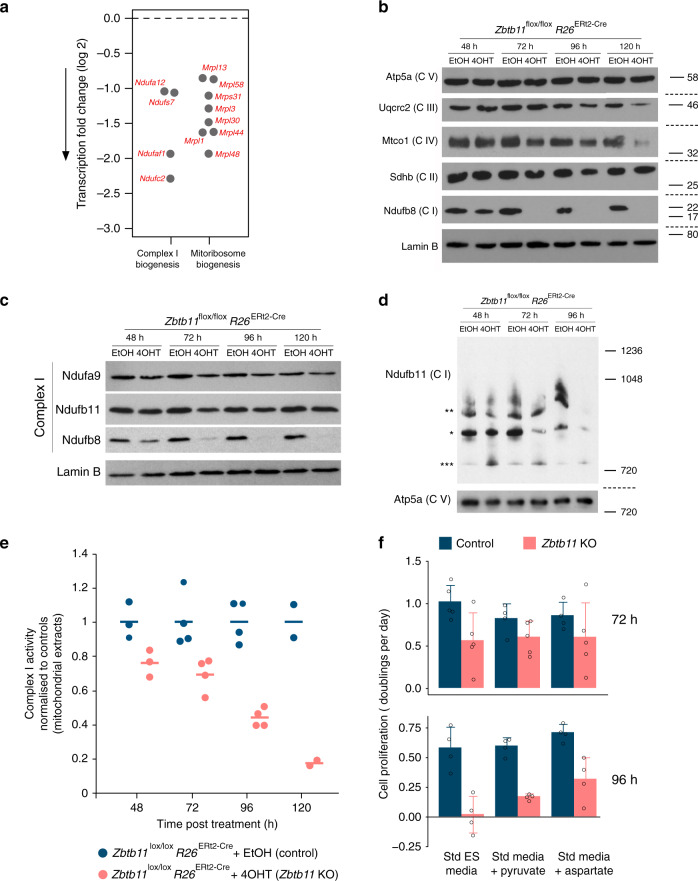
Fig. 6. Zbtb11 controls assembly and stability of respiratory complex I.
a Differentially expressed genes mapping to enriched mitochondrial pathways (see also downregulation of Ndufc2 at the protein level in Fig. 3e). b Immunoblots of whole-cell lysates from control and Zbtb11 KO cells, probing stability markers of all five OXPHOS complexes. Molecular weight marker unit is kDa. Note that none of the stability markers probed in the blot are affected at the transcriptional level by Zbtb11 depletion; the downregulation of Ndufb8 is a consequence of complex I instability caused by downregulation of other complex I subunits that are under direct Zbtb11 control, as listed in a (Fig. 3e). Source data are provided as a Source Data file. c SDS-PAGE and immunobloting of complex I subunits in whole-cell lysates of control and Zbtb11 KO cells showing that not all complex I subunits are downregulated. Lamin B is shown as a loading control. Source data are provided as a Source Data file. d Immunoblot of native mitochondrial extracts separated by BN-PAGE. Complex I was detected with antibodies to the Ndufb11 subunit (which was not affected by Zbtb11 depletion, c). Note the reduction in complex I holocomplexes (*) and supercomplexes (**), and the increase in a smaller Ndufb11-containing assembly intermediate (***). Complex V detected with anti-Atp5a antibodies is shown as a loading reference. Molecular weight marker unit is kDa. Source data are provided as a Source Data file. e Spectrophotometric quantification of complex I activity in mitochondrial extracts from control and Zbtb11 KO cells. Individual data points and means are shown for n = 3 (48 h), n = 4 (72 and 96 h) and n = 2 (120 h) independent experiments. f Rates of cell proliferation in control and Zbtb11 KO cells grown in standard ES media (Std ES), and in media supplemented with supraphysiological amounts of pyruvate (Pyr) or aspartate (Asp). Bars represent mean and standard deviation of n = 5 (72 h) and n = 4 (96 h) independent experiments (shown as open circles). Source data are provided as a Source Data file.

