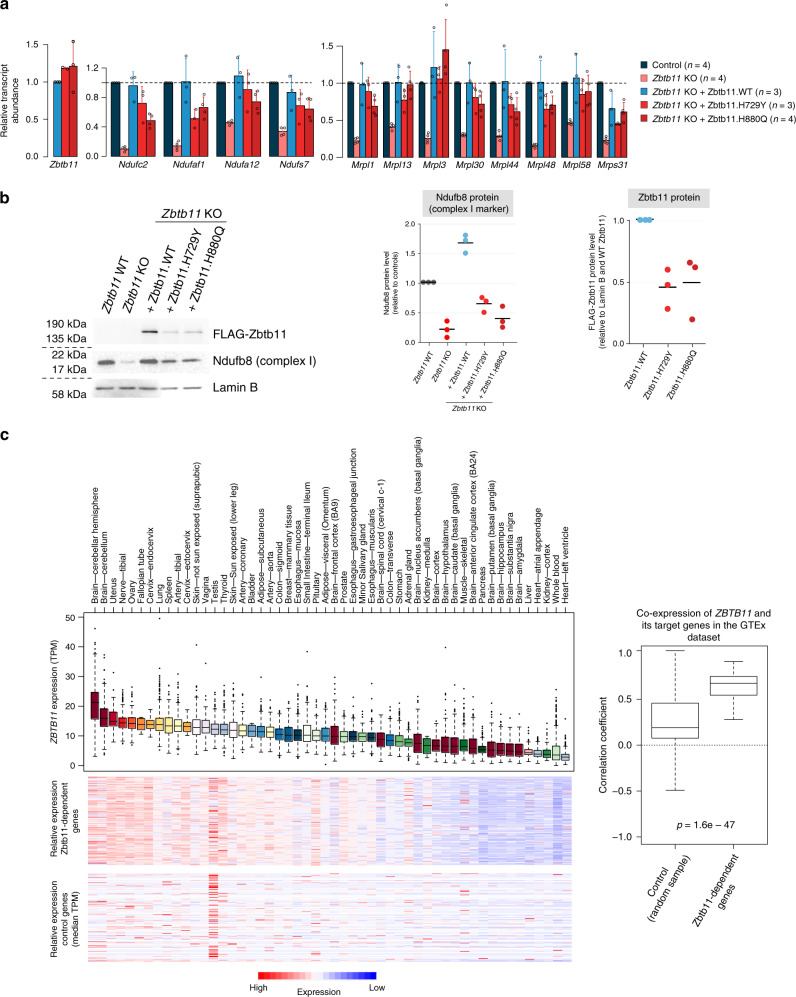
Fig. 8. Mutations associated with intellectual disability destabilise the Zbtb11 protein and impair complex I biogenesis.
a qPCR quantification of transcripts in control and Zbtb11 KO cells rescued with either wild-type (WT) or mutant Zbtb11 cDNA. Zbtb11lox/lox Rosa26ERt2-Cre cells were treated with either EtOH (Control) or 4OHT (Zbtb11 KO), and concomitantly transfected with a plasmid expressing either WT or the indicated mutant FLAG-Zbtb11 cDNA fused to an IRES-GFP reporter. Forty-eight hours later, successfully transfected cells were sorted based on GFP expression, gating on cells with intermediate fluorescence, thus selecting cells expected to have similar levels of cDNA expression. Bars represent mean and standard deviation. Source data are provided as a Source Data file. b Immunoblot of whole-cell lysates of Zbtb11 KO cells rescued with either WT or mutant Zbtb11 cDNA. Cells treated and sorted as in a, except collected 72 h post Zbtb11 KO induction, were analysed by immunoblotting for the complex I stability marker (Ndufb8) and FLAG-Zbtb11 expression. Lamin B was used as a loading reference. Left panel shows a representative image of the results, while the two panels on the right show the quantification of the blots from three biological replicates. Source data are provided as a Source Data file. c Correlation of expression between Zbtb11 and its target genes in primary human tissues. Box plot to the left shows normalised expression of human ZBTB11 across primary tissues sampled in the GTEx dataset. The heatmaps below represent the same tissues as in the box plot and median expression values for the human orthologues of Zbtb11-dependent genes (upper panel), and for an equal number of randomly selected genes as control (lower panel). Box plot to the right shows distribution of correlation coefficients for expression of ZBTB11 and that of individual target genes across the GTEx tissues. P = p value for two-sided Wilcoxon’s rank-sum test. Box plots show the interquartile range (box outline) and median value (horizontal line), with the whiskers delineating the lower and upper limits of the data. Number of individual samples (n) in the GTEx database varies for each individual tissue, as follows: brain—cerebellar hemisphere = 215; brain—cerebellum = 241; uterus = 142; nerve—tibial = 619; ovary = 180; fallopian tube = 9; cervix—endocervix = 10; lung = 578; spleen = 241; artery—tibial = 663; cervix—ectocervix = 9; skin—not sun exposed (suprapubic) = 604; vagina = 56; testis = 361; thyroid = 653; skin—sun exposed (lower leg) = 701; artery—coronary = 240; bladder = 21; adipose—subcutaneous = 663; artery—aorta = 432; colon—sigmoid = 373; breast—mammary tissue = 459; oesophagus—mucosa = 555; small intestine—terminal ileum = 187; pituitary = 283; adipose—visceral (omentum) = 541; brain—frontal cortex (ba9) = 209; prostate = 245; oesophagus—gastroesophageal junction = 375; minor salivary gland = 162; oesophagus—muscularis = 515; brain—spinal cord (cervical c-1) = 159; colon—transverse = 406; stomach = 359; adrenal gland = 258; brain—nucleus accumbens (basal ganglia) = 246; kidney—medulla = 4; brain—cortex = 255; brain—hypothalamus = 202; brain—caudate (basal ganglia) = 246; muscle—skeletal = 803; brain—anterior cingulate cortex (ba24) = 176; pancreas = 328; brain—putamen (basal ganglia) = 205; brain—hippocampus = 197; brain—substantia nigra = 139; brain—amygdala = 152; liver = 226; heart—atrial appendage = 429; kidney—cortex = 85; whole blood = 755; heart—left ventricle = 432.

