Figure 3.
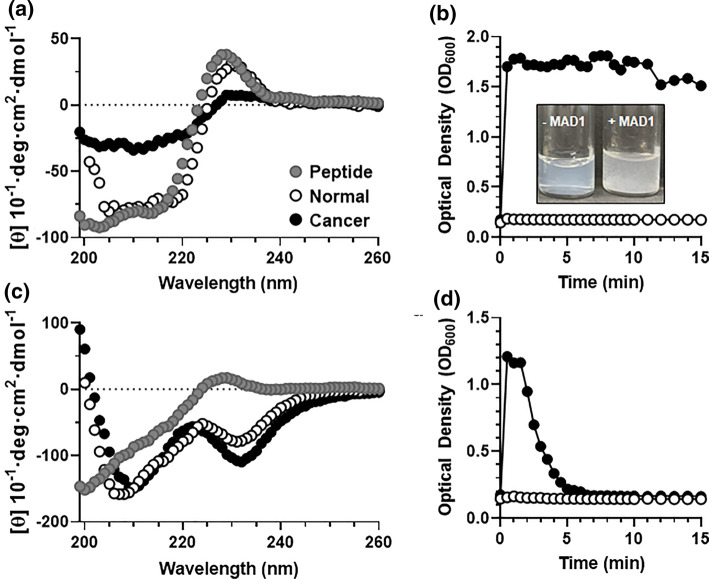
Tumor membrane-templated ACP assembly. (a) Circular dichroism spectra of the MAD1 peptide in aqueous solution (●), or in the presence of normal (○) and cancer cell (●) membrane models. (b) Relative disruption of normal (○) and cancer (●) model membranes by the MAD1 peptide, as determined from optical density measurements (OD600). Inset: image of cancer membrane liposomal solution before (-MAD1) and after (+MAD1) treatment with the peptide. Formation of large flocculates provides visual confirmation of liposome disruption. (c) Circular dichroism spectra and (d) optical density measurements of DAP1 in the absence or presence of model membranes (● = no membrane, ○ = normal membrane, ● = cancer membrane).

