Figure 5.
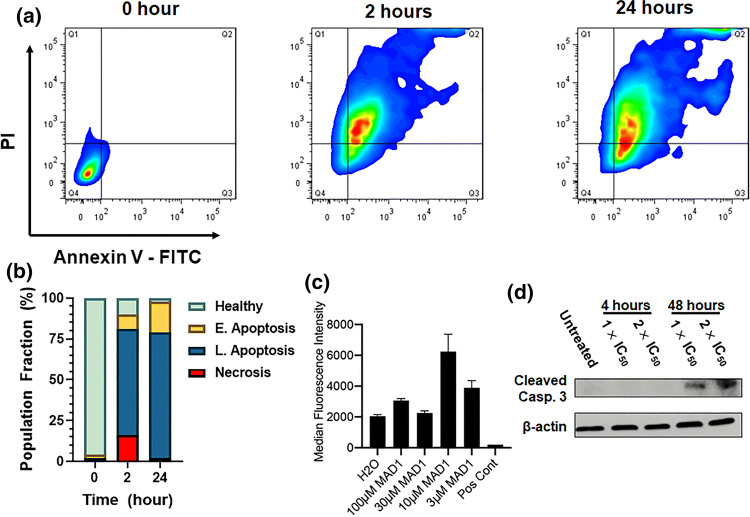
Mechanism of antitumor action by MAD1. (a) Representative plots from flow cytometric PI/Annexin V-FITC apoptosis assays of OVCAR-3 cells treated with 14 μM of MAD1 for 2 or 24 h. (b) Quadrant quantification of flow cytometry data defining the healthy cell population from necrotic cells, or those in early and late apoptosis, as a function of incubation time with the peptide. (c) Quantification of TMRE fluorescence for OVCAR-3 cells treated with varying concentrations of MAD1. Water or FCCP were included as a negative and positive control, respectively. (d) Western blot analysis of cleaved caspase 3 from OVCAR-3 cells after incubation with medium alone (untreated), or MAD1 at 1× and 2× its IC50 for 4 and 48 h.

