Figure 3.
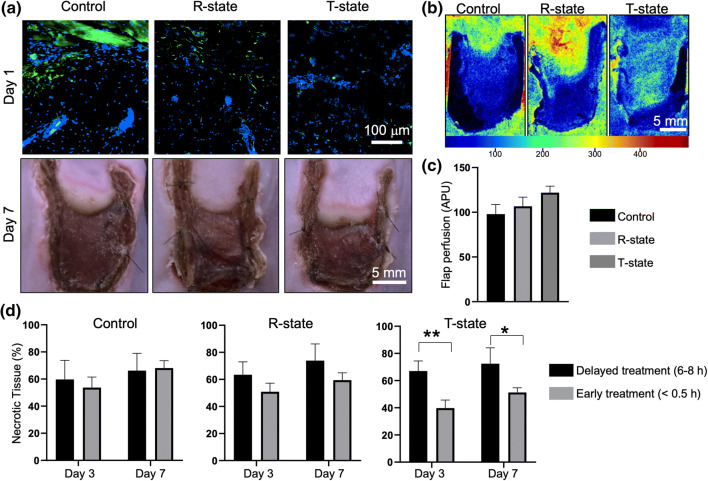
(a) Pimonidazole staining of tissue hypoxia (at t = 1 day, top) and corresponding photographs of skin flaps (at t = 7 days, bottom) that had been immediately injected with PBS (control, left), R- (middle), and T-state (right) PolyHb. (b) LSI imaging and (c) quantification of perfusion for each group at t = 7 days (APU: arbitrary perfusion units). No significant changes in perfusion were seen as a function of treatment. (d) Quantification of necrotic tissue progression as a function of treatment type and timing (*p = 0.06; **p = 0.03).

