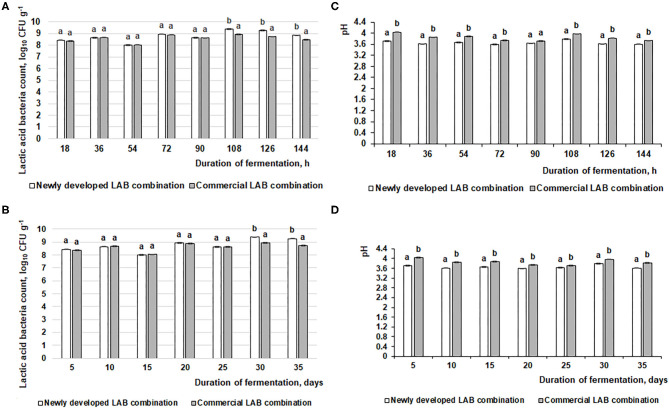
Figure 2.
Changes in pH and lactic acid bacteria (LAB) count (log10 CFU g−1) during the feed fermentation. (A,C) LAB count and pH of the feed after 18, 36, 54, 72, 90, 108, 126, and 144 h. (B,D) LAB count and pH of the feed after 5, 10, 15, 20, 25, 30, and 35 days. Data are expressed at the mean ± standard deviation (n = 10). Data were statistically compared with a paired t-test and column statistics; p ≤ 0.05 was considered significant. Each parameter, means followed by different letters are significantly different (p ≤ 0.05).

