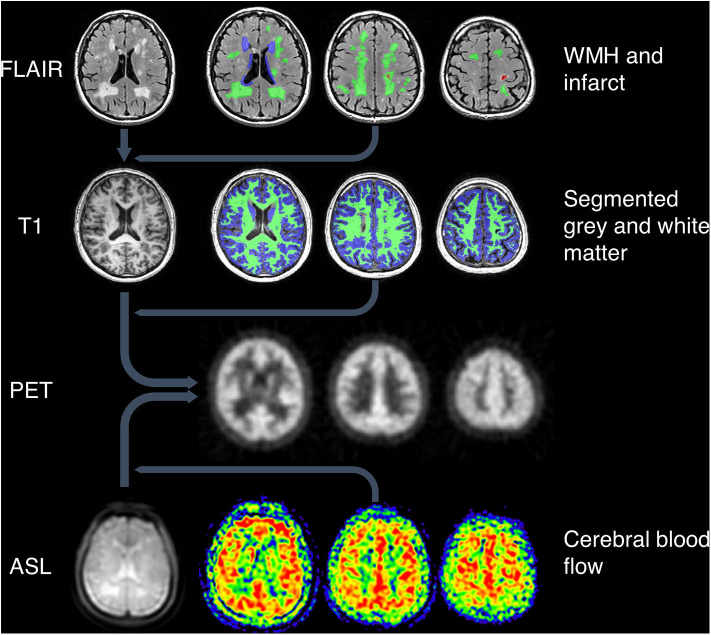
Figure 1.
Image processing pipeline. Top: WMH and infarcts were drawn on T2-weighted FLAIR images, which were co-registered with T1-weighted images along with the ROIs. Green = deep WMH. Blue = periventricular WMH. Red = infarct lesion. Second row: grey and white matter were segmented using T1-weighted images. Green = white matter. Blue = gray matter. All MRI images and ROIs were then co-registered to PET space (third row). Bottom row: ASL proton density images (left image) were co-registered to PET space along with CBF maps (right three images).

