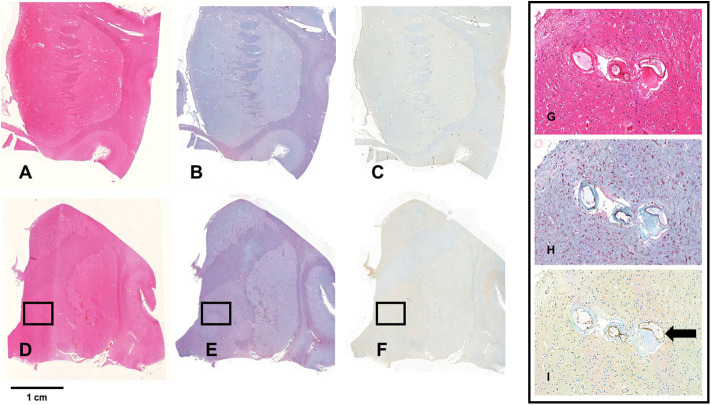
Figure 4.
Staining for Iba1 and TSPO. (A–F) Show whole mount sections from the anterior (A–C) and posterior basal ganglia (D,E) from a brain with severe SVD. The sections are stained with hematoxylin-eosin (A,D), and with immunochemistry for Iba1 (B,E) and TSPO (C,F). The bar indicates 1 cm. The framed areas show the inner segment of the globus pallidus. Pictures G-I show a x20 magnification of the framed area. Perforating arteries have thickened walls (G, HE—x20); there is florid microglial and macrophagic response (red cells) (H, Iba1 immunostain—x20); TSPO expression is low and limited to a minority of microglia cells. In contrast, endothelial cells are intensely positive (arrow) (I, TSPO immunostain—x20).

