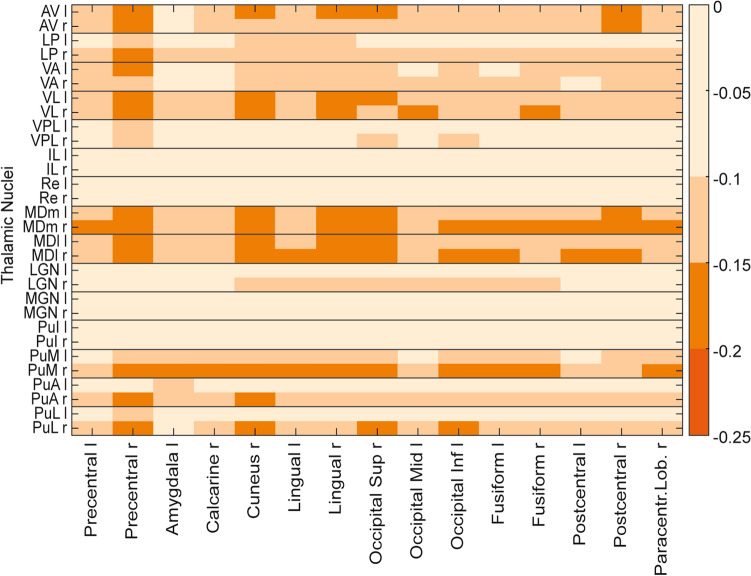
Figure 4.
Functional connectivity decreases for thalamic subregions. Correlation decreases between thalamic subregions are displayed in an exploratory analysis. The connectivity matrix includes all thalamic subregions (l: left; r: right) defined in the AAL3 atlas and all cortical regions for which at least one decrease exceeded − 0.15. AV anteroventral, LP lateral posterior, VA ventral anterior, VL ventral lateral, VPL ventral posterolateral, IL: intralaminar, Re reuniens, MDm mediodorsal medial, MDl mediodorsal lateral, LGN lateral geniculate, MGN medial geniculate, PuI pulvinar inferior, PuM: pulvinar medial, PuA pulvinar anterior, PuL pulvinar lateral.

