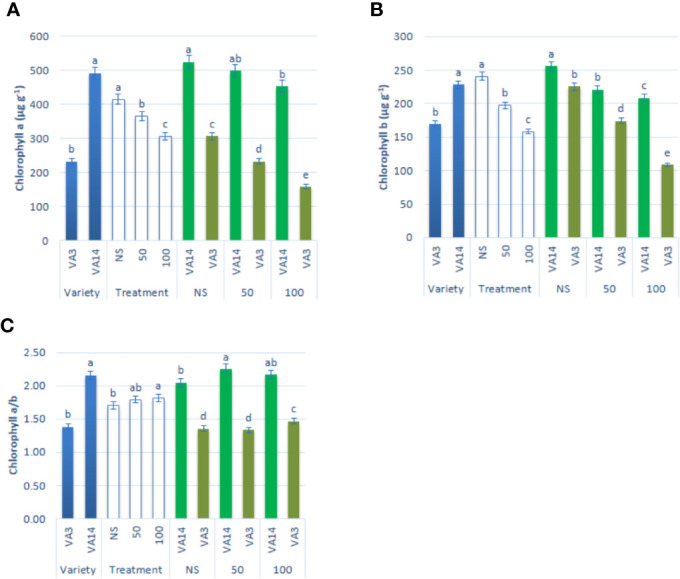
Figure 2.

Effect of different salinity levels on photosynthetic pigment biosynthesis: chlorophyll a (A), chlorophyll b (B) and chlorophyll a/b (C) in A. tricolor. Values are means of four replicates and different letters are differed significantly by Duncan Multiple Range Test (P < 0.01).
