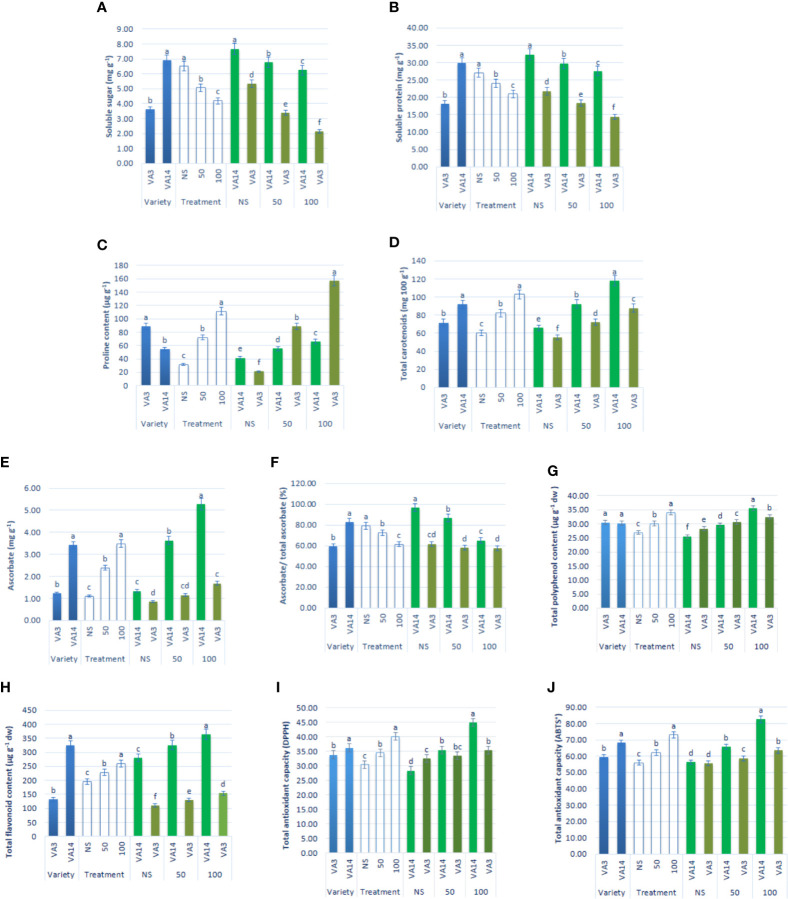
Figure 4.
Effect of different salinity levels on compatible solutes and non-enzymatic antioxidants: soluble sugar (A), soluble protein (B), proline content (C), total carotenoid (D), reduced ascorbate (AsA, E), ascorbate redox status (reduced/total ascorbate, F), total polyphenol content (GAE µg g-1 dw, (G), total flavonoid content (RE µg g-1 dw, (H), total antioxidant capacity (DPPH) (TEAC µg g-1 dw, (I) and total antioxidant capacity (ABTS+) (TEAC µg g-1 dw, (J) in A. tricolor. Values are means of four replicates and different letters are differed significantly by Duncan Multiple Range Test (P < 0.01).

