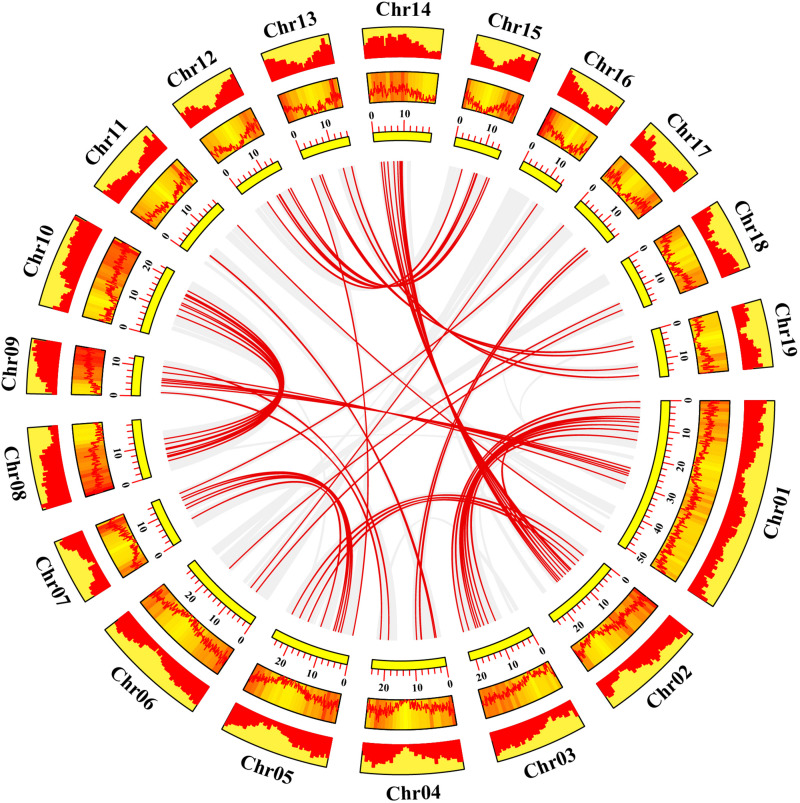
FIGURE 3.
Collinearity analysis of poplar R2R3-MYB genes. Yellow rectangles represent chromosomes 01–19 of poplar. The line graph, heatmap and histogram in the orange rectangles represent the gene density on the chromosomes. Gray lines indicate all synteny blocks in the poplar genome, and the red lines between chromosomes represent the segmental duplicate gene pairs.

