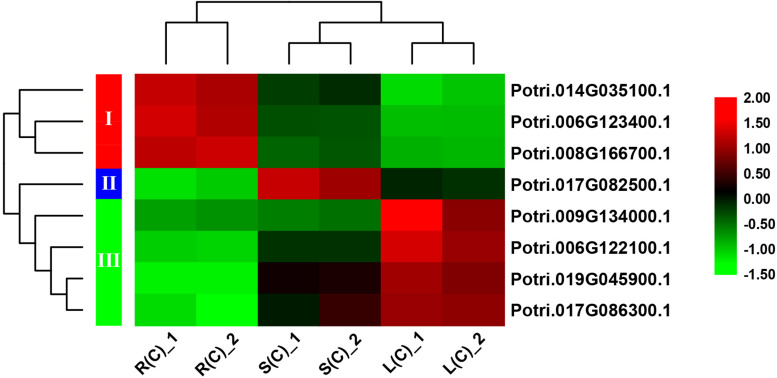
FIGURE 6.
A heatmap of eight genes shared by the pairwise tissue comparisons without treatment. L(C), leaves without treatment; S(C), stems without treatment; R(C), roots without treatment. The gene expression levels are square-root transformed FPKM values. The colorful vertical bars on the left side denote gene clusters.

