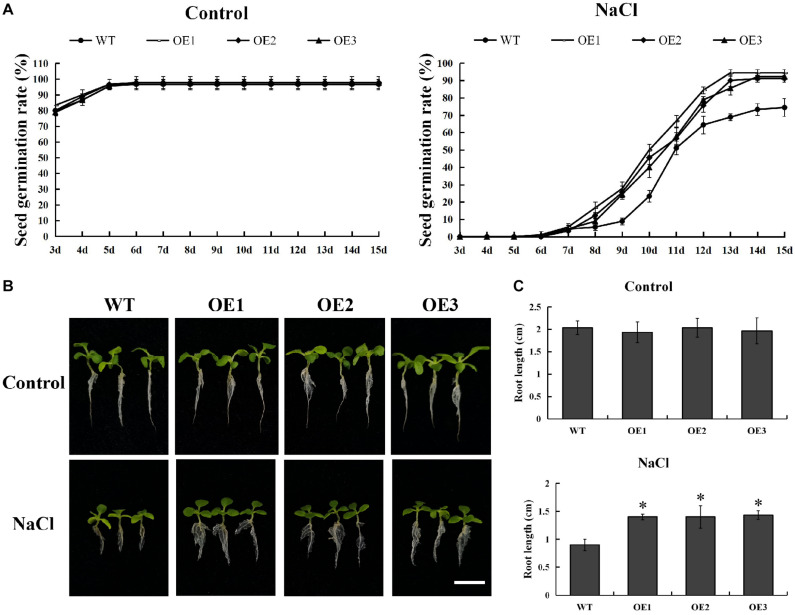
FIGURE 9.
Comparison of seed germination rate and root length between wild-type lines and transgenic lines. (A) Seed germination rate of different lines under 0 or 150 mM NaCl. (B) Comparison of growth phenotypes among different lines under 0 or 150 mM NaCl. Scale bars = 1 cm. (C) Root length of different lines under 0 or 150 mM NaCl. Three biological replicates were used. The error bars represent standard deviation. Asterisks (*) indicate significant differences between transgenic lines and wild type lines (t-test, P < 0.05).

