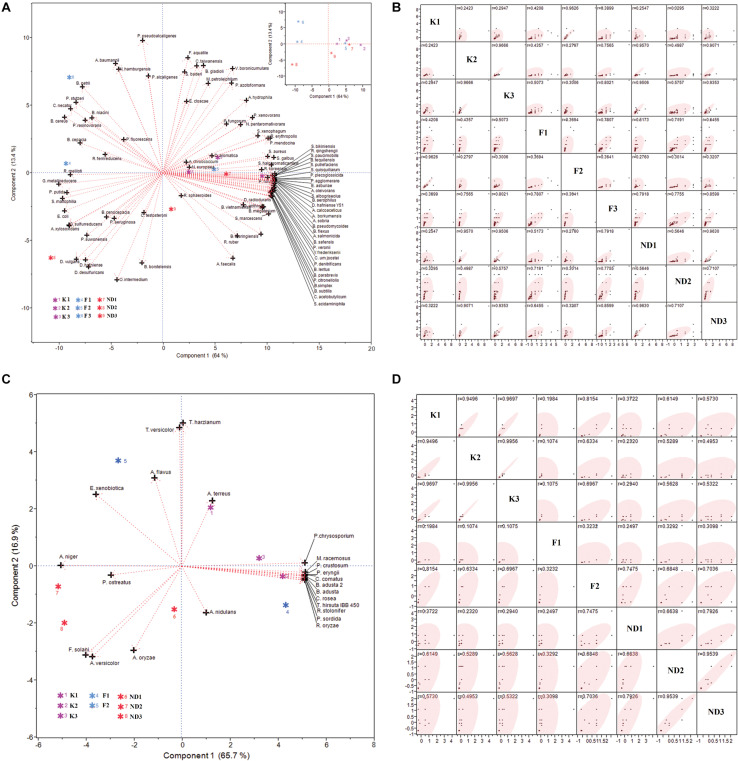
FIGURE 4.
PCA biplot and Scatter Plot Matirx of relative abundance of bioremediation bacteria (A and B, respectively) and fungi (C and D, respectively) found at the test sites. PC1 and PC2 together could explain 77.4% and 82.6% of variability in relative abundance of bacteria and fungi, respectively.

