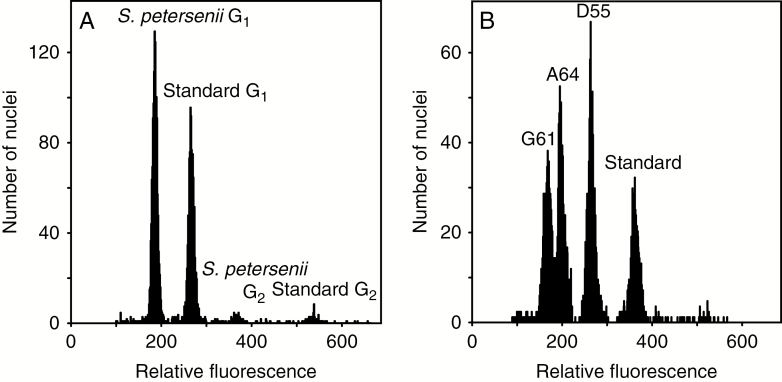
Fig. 3.
Flow cytometric histograms showing relative fluorescence of propidium iodide-stained nuclei of Synura petersenii samples and Solanum pseudocapsicum (Standard). (A) A representative analysis of a single S. petersenii strain with G1 and G2 phase nuclei apparent for both the analysed sample and standard. (B) A simultaneous analysis of three strains with distinct genome size (G61, A64 and D55) to confirm the existing differences.

