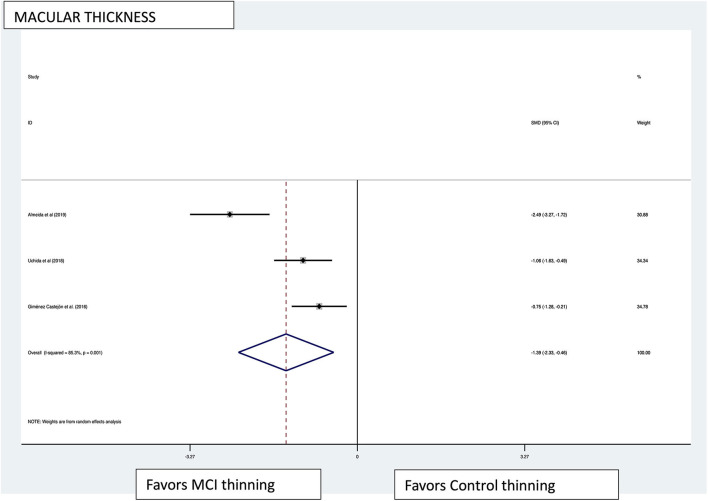
Figure 3.
Macular thickness pooled effect size forest plot. Forest plot comparing the pooled effect size of change in macular thickness of Mild Cognitive Impairment (MCI) subjects and healthy controls. Weighted Hedges' g test for effect size analysis (blacksquare) and 95% confidence interval for each study.

