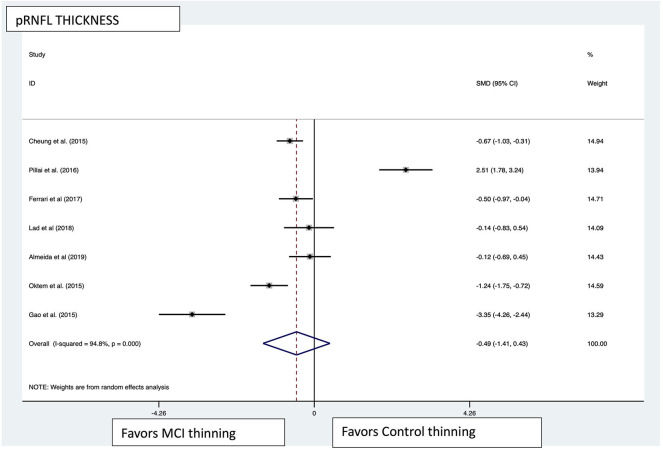
Figure 6.
pRNFL pooled effect size forest plot. Forest plot comparing the pooled effect size of change in peripapillary retinal nerve fiber layer (pRNFL) thickness between Mild Cognitive Impairment (MCI) subjects and healthy controls. Weighted Hedges' g test for effect size analysis (blacksquare) and 95% confidence interval for each study.

