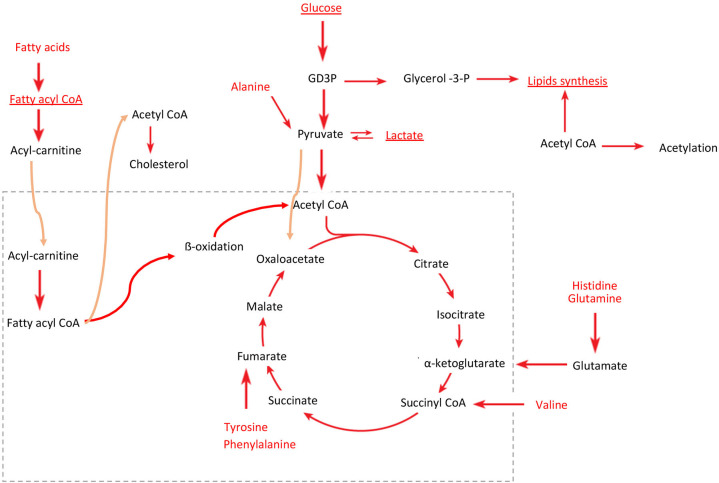
Figure 5.
Predicted perturbed energy metabolism pathways in osteosarcoma. Red indicates the metabolites identified by 1H-NMR. Underlined are the key metabolites that discriminated against the patients with osteosarcoma from healthy controls in the PLS-DA model, identified by the higher VIP scores. Dotted box represents mitochondria, and orange arrows indicate the metabolite flux between the inside and outside of the mitochondria.

