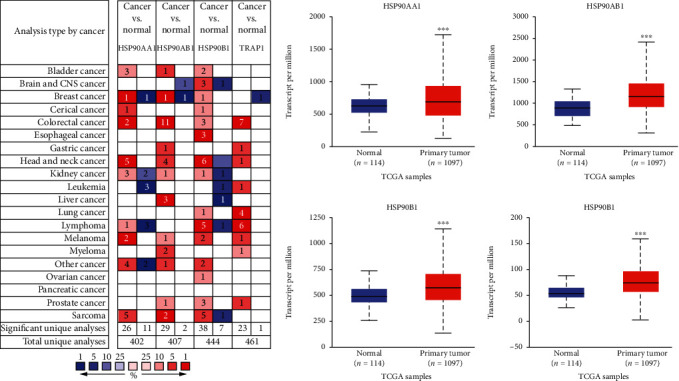
Figure 1.

Transcriptional expression of HSP90s isoforms in various kinds of human cancers and BRAC. (a) Transcriptional expression of HSP90s isoforms in various kinds of cancers (the Oncomine). Notes: number in the colored cell is equal to the number of datasets with statistically significant HSP90s mRNA up expression (red) or down expression (blue), compared with the corresponding normal samples. Color depth represents a median rank of a gene, across all the included analyses. (b) Transcriptional expression of HSP90s isoforms in BRAC, compared with the normal breast tissues (the UALCAN) (∗P < 0.05, ∗∗P < 0.01, and ∗∗∗P < 0.001).
