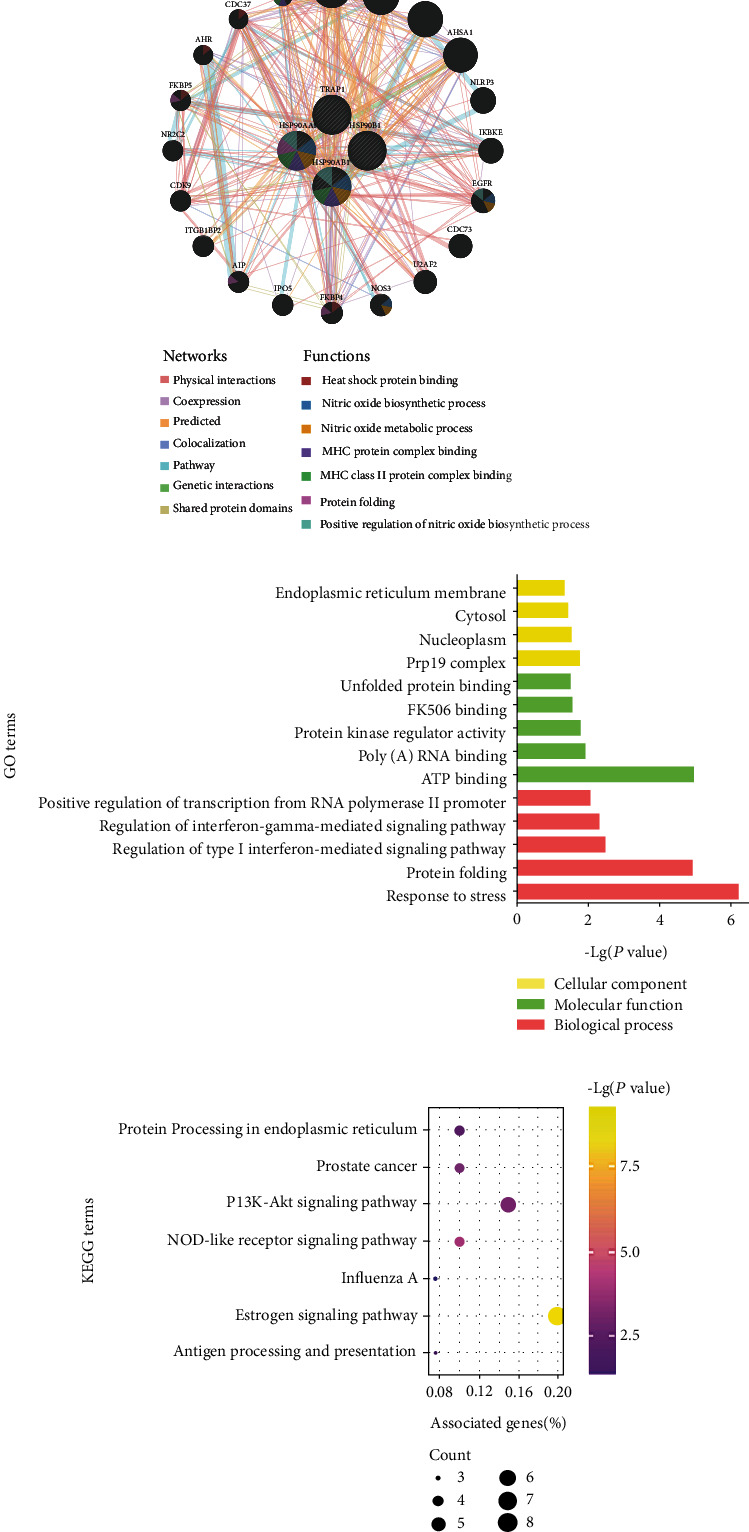
Figure 6.

Functions of HSP90s interaction network. (a) The gene interaction network of HSP90s constructed by the GeneMANIA. Note: distinct colors of the network edges represent the distinct bioinformatic methods applied: physical interactions, coexpression, predicted, colocalization, pathway, genetic interactions, and shared protein domains. Distinct colors of the network nodes represent the biological functions of the sets of genes. (b) The results of GO enrichment analysis: the top five terms of BP and MF and all terms of CC are shown. (c) The results of KEGG enrichment analysis: all KEGG terms are shown.
