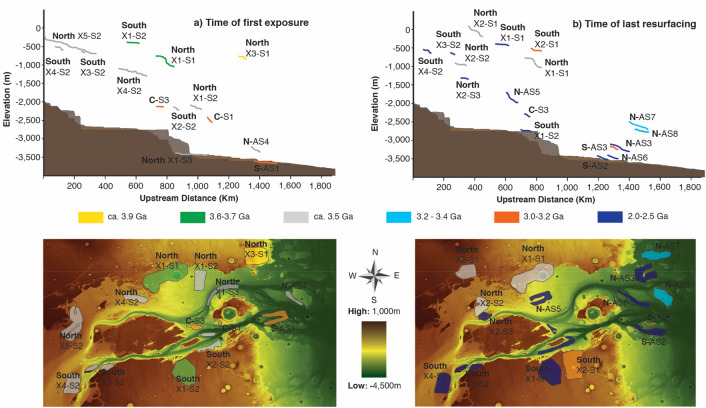
Figure 1.
Representation of the evolution of the longitudinal profile of Kasei Valles. On the left are two panels where the different colors represent the first exposure of surfaces within Kasei Valles. On the right, the panels with different colors represent the date of last resurfacing/abandonment of surfaces within Kasei Valles. At the top are the longitudinal representation of these surfaces. At bottom are the spatial distribution of these surfaces. The coding indicates the cross section number (X), the surface within the cross section (S) and whether it is in the North or South tributary. Alternatively, the coding indicates when the surface correspond to an abandoned channel (AS) or surface formed by the river capture (C). The base map for both panels (a, b) is a color-coded shaded-relief MOLA DEM (460 m/pixel). Credit: MOLA Science Team, MSS, JPL, NASA. We produced these maps in this figure using Esri’s ArcGIS 10.6 software (https://www.esri.com/software/arcgis) and the mosaic using Adobe’s Illustrator CS6 software (https://www.ado-be.com/es/products/illustrator.html).

