Figure 1.

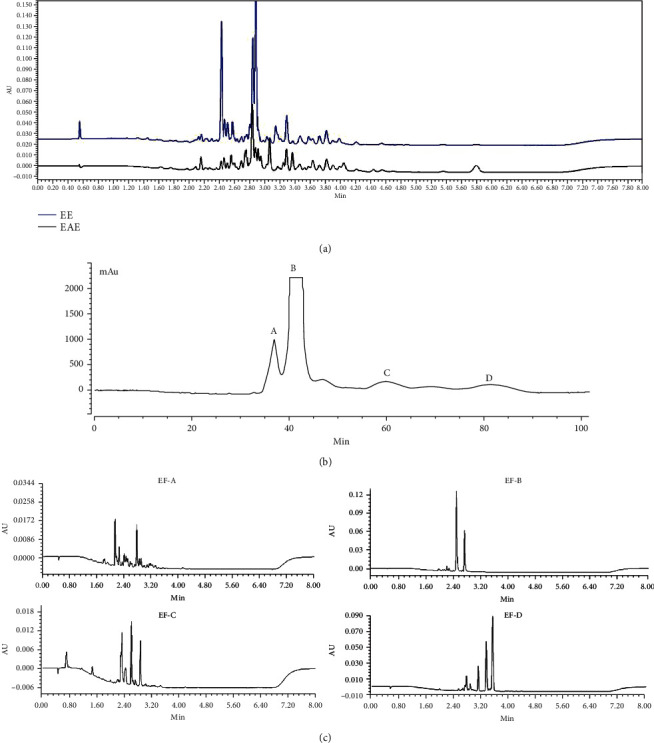
Chemical composition analysis: (a) UPLC chromatograms of EE and EAE detected at 280 nm; (b) four fractions of EAE isolated by HSCCC; (c) UPLC chromatograms of EF-A, EF-B, EF-C, and EF-D detected at 280 nm.

Chemical composition analysis: (a) UPLC chromatograms of EE and EAE detected at 280 nm; (b) four fractions of EAE isolated by HSCCC; (c) UPLC chromatograms of EF-A, EF-B, EF-C, and EF-D detected at 280 nm.