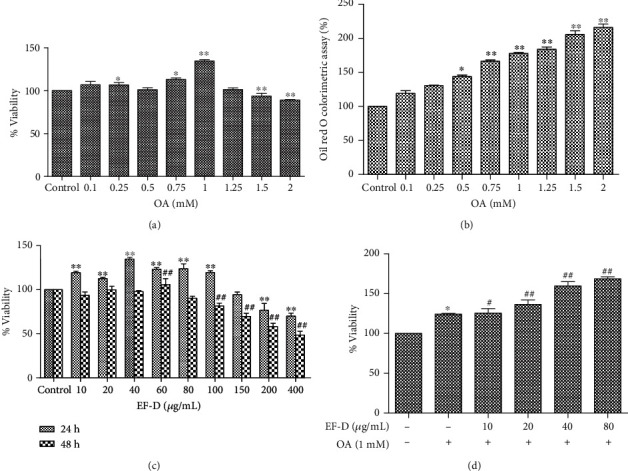
Figure 3.

Cell viability and the TG accumulation effects of OA and EF-D:(a) HepG2 cells were treated with OA in different concentrations (0.1-2 mM) for 24 h; (b) cells were stained with ORO; (c) cell viability of EF-D for 24 h and 48 h; (d) cell viability of OA+EF-D. ∗p < 0.05 and ∗∗p < 0.01 versus control. #p < 0.05 and ##p < 0.01 versus OA.
