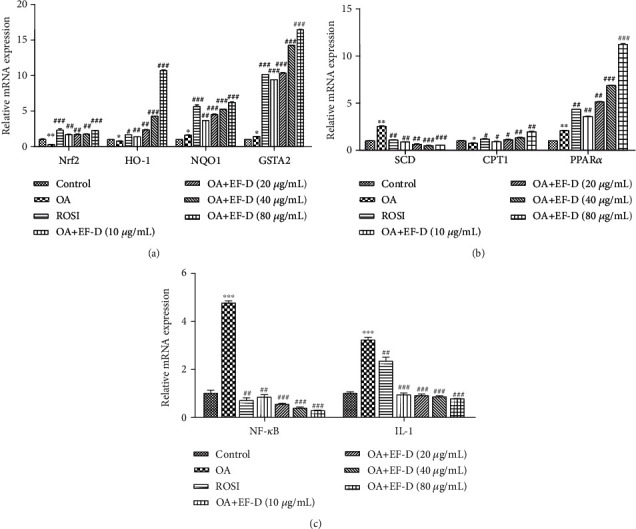
Figure 6.

Effects of EF-D on the mRNA expression of oxidative stress and inflammatory cytokine genes: (a) Nrf2, HO-1, NQO1, and GSTA2; (b) SCD, CPT1, and PPARα; (c) NF-κB and IL-1 mRNA expression. Data are represented as mean ± SD (n = 3). ∗p < 0.05 and ∗∗p < 0.01 OA versus control. ##p < 0.01 and ###p < 0.001 OA+ROSI and OA+EF-D versus OA.
