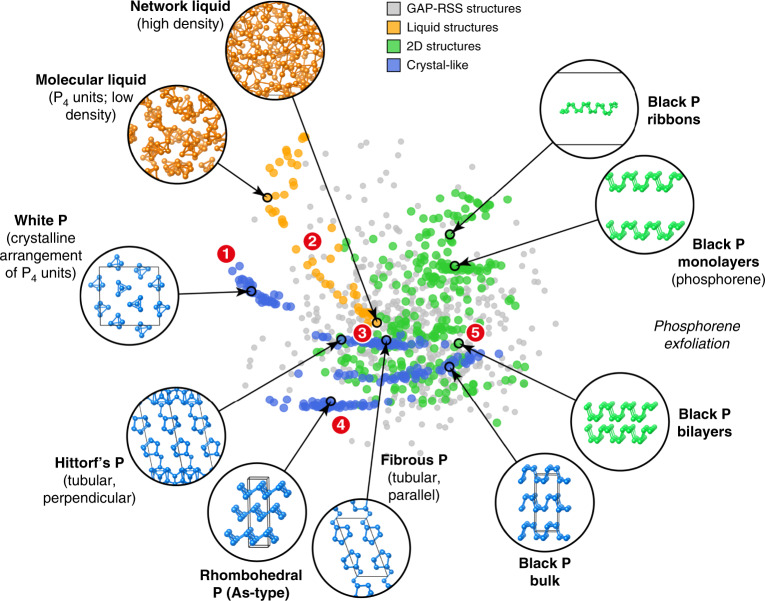
Fig. 1. A GAP fitting database for elemental phosphorus.
The relationships between the structures in the database are visualised through 2D embedding of a SOAP similarity metric. Example structures are shown, and specific points of interest are highlighted by numbers: the closeness between molecular crystalline (white P, 1) and liquid P4, the transition between the molecular and network liquid (2), the similarity between Hittorf’s and fibrous P, which both consist of extended tubes and fall in the same island on the plot (3), an isolated set of points corresponding to As-type structures (4) and the exfoliation from black P into bilayers (5) and monolayers. The GAP–RSS dataset from ref. 58, finally, is shown using smaller grey points and spans a wide range of configurations (see also Supplementary Fig. 1). Note that this map does not include the isolated P, P2 and P4 configurations, as it aims to survey the space of extended P structures.

