
Fig. 3. Validation of the ML force field.
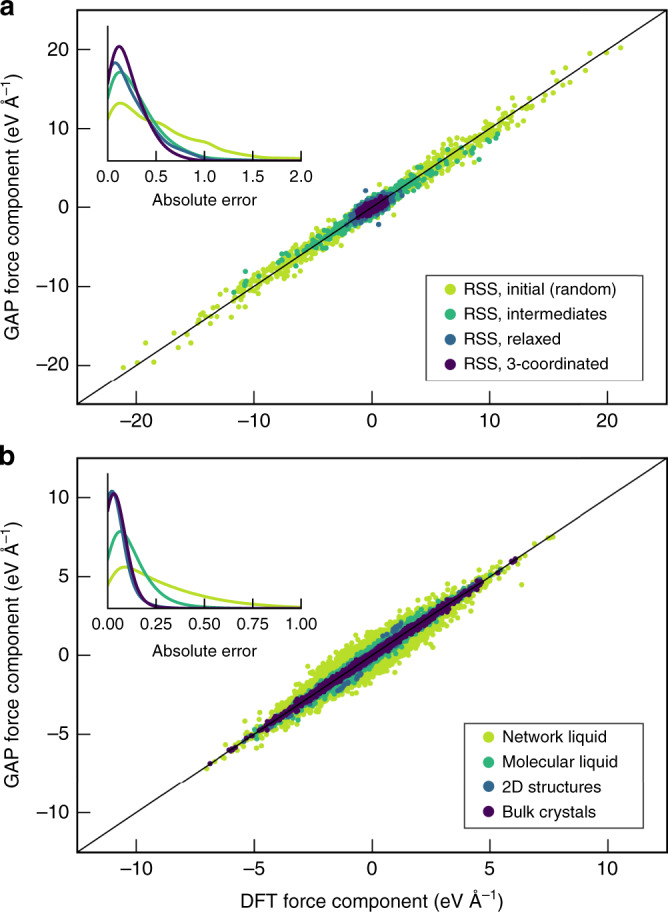
Scatterplots of Cartesian force components for a test set of structures, which has not been included in the fit, comparing DFT + MBD computations with the prediction from GAP + R6. Data are shown for different sets of the GAP–RSS-generated (panel a) and manually constructed (panel b) parts of the database. The insets show kernel-density estimates (“smoothed histograms”) of absolute errors with the same colour coding. Note the difference in absolute scales for the force components between the two panels.