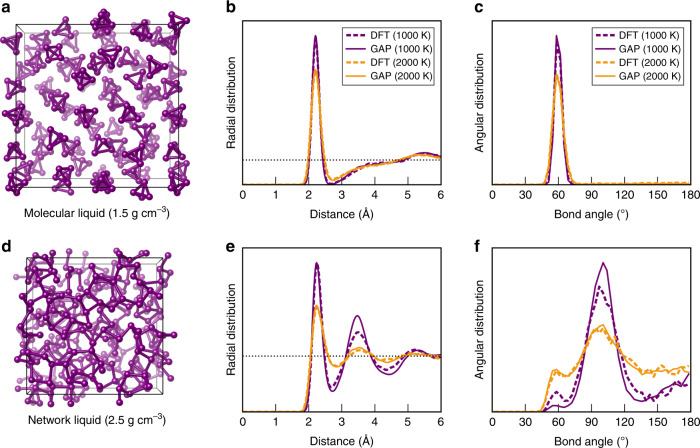
Fig. 6. Liquid phosphorus.
MD simulations in the NVT ensemble, benchmarking the quality of the GAP + R6 ML force field for the description of liquid phosphorus. a Snapshot of a DFT-MD simulation of a system containing 62 P4 molecules at a fixed density of 1.5 g cm−3, corresponding to the low-density liquid (or fluid). b Radial distribution functions for this system at two different temperatures, taken from the last 10 ps of the trajectories. Solid lines indicate GAP-MD simulations, whereas dashed lines show the results of reference DFT-MD trajectories. c Same for angular distribution functions (ADF), computed using a radial cut-off of 2.7 Å. d–f Same but for the network liquid at a much higher density of 2.5 g cm−3. The slightly more “jagged” appearance of the DFT data in panel f is due to the smaller number of structures that are sampled from the trajectory.

