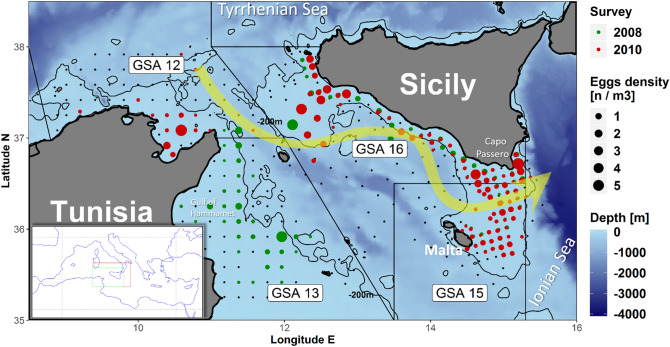
Figure 1.
Spatial distribution of anchovy eggs in both sides of the Strait of Sicily, as obtained by the ichthyoplanktonic survey, conducted in the summers 2008 and 2010 in the two study areas22,60. The solid curves represent the 200-m depth isoline; the yellow arrow represents the climatologic path of the AIS19. The inner panel indicates the Strait of Sicily (green box) within the Mediterranean Sea; the red box indicates the broader area that results from the Lagrangian back-tracking (Figs. 3 and 4), as well as the area considered for the DEB modelling (Fig. 5).

