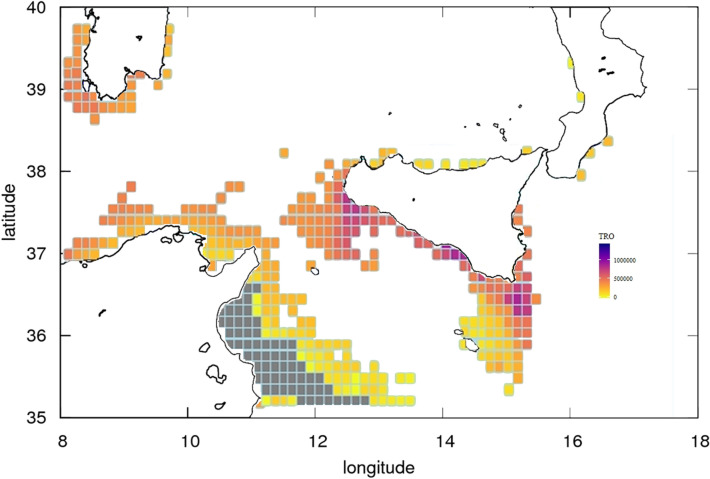
Figure 5.
Quantitative map of Total Reproductive Output (TRO, n. eggs/n. of reproductive events, DEB model outcome) described by a continuous scale ranging (from 0 to 1,400,000) across the study area (years 2009–2012). Grey cells refer to pixel where, due to local conditions, the species do not produce eggs. Distributional range of the species was modeled within the bathymetric contour of − 200 m. Map was generated using GIMP 2.8 (https://gimp.org).

