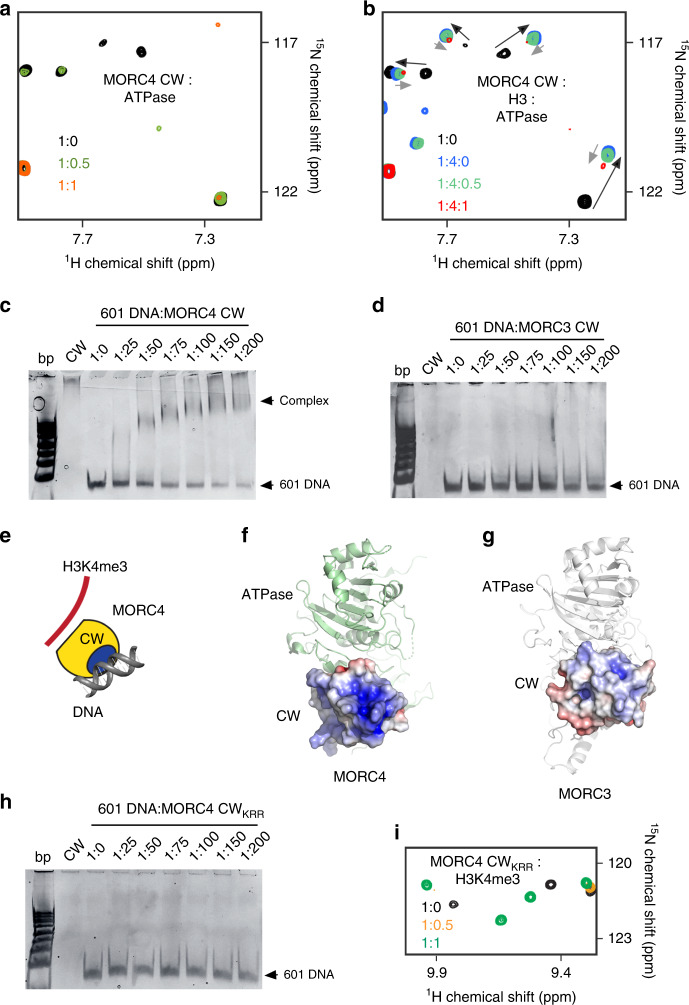
Fig. 3. MORC4 CW binds to DNA.
a Superimposed 1H,15N HSQC spectra of the 15N-labeled MORC4 CW domain collected upon titration with the unlabeled ATPase domain of MORC4. b Superimposed 1H,15N HSQC spectra of the 15N-labeled MORC4 CW domain (in complex with H3 peptide) collected upon titration with the unlabeled ATPase domain. Spectra in (a, b) are color coded according to the protein-to-ligands molar ratio. (c, d) EMSA with 601 DNA in the presence of increasing amounts of MORC4 CW (c) and MORC3 CW (d). e Cartoon representation of MORC4 CW in complex with histone H3K4me3 tail and DNA. f, g Electrostatic surface potential of the CW domain of MORC4 (f) and MORC3 (g) (within the ATPase-CW cassette) was generated using APBS in Pymol with a range of –5/5 kT/e and colored blue and red for positive and negative charges, respectively. The ATPase domain is shown as ribbon and colored green and white in MORC4 and MORC3, respectively. The missing loops (residues K441 and R463) in the model of MORC4 CW were completed for this figure. h EMSA with 601 DNA in the presence of increasing amounts of mutant MORC4 CWKRR. i Superimposed 1H,15N HSQC spectra of the 15N-labeled MORC4 CWKRR domain collected upon titration with the histone H3K4me3 peptide. Spectra are color coded according to the protein-to-peptide molar ratio.

