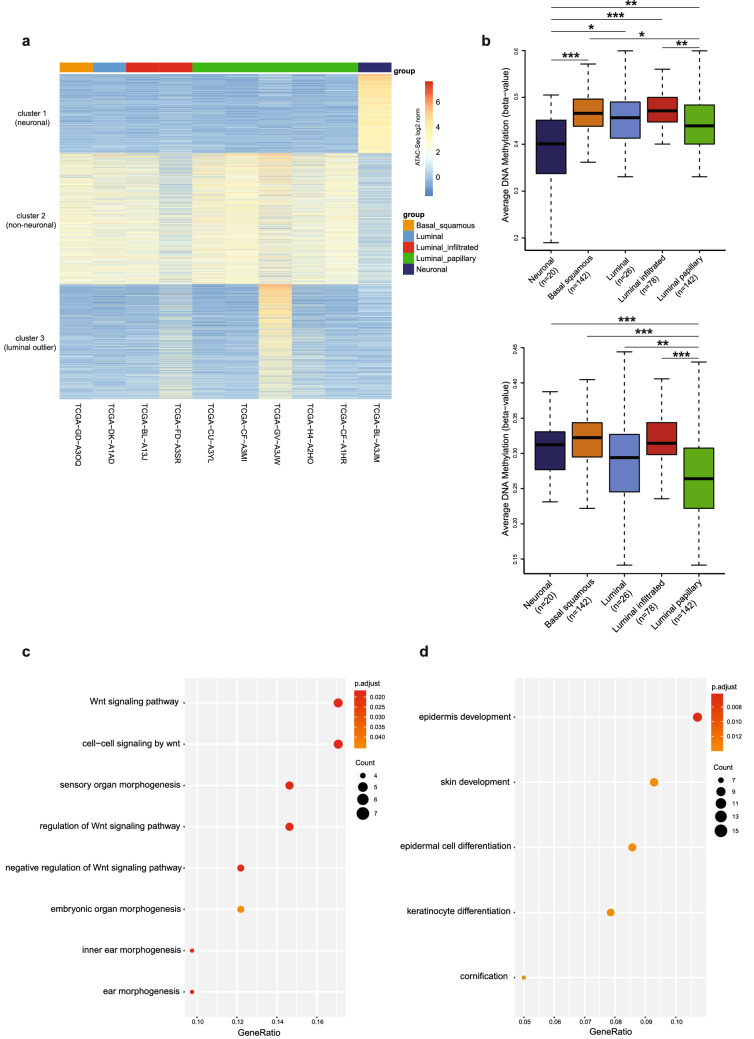
Figure 2.
Subgroup specific regulatory regions of bladder cancer. (a) Heatmap visualization of the k-means clustering of most variable bladder cancer ATAC-seq peaks. Color annotations refer to mRNA subgroups identified in the study7. Three clusters were represented; cluster 1: neuronal, cluster 2: non-neuronal and cluster 3: luminal outlier. (b) DNA methylation levels (Beta values) of mRNA subgroups on the regulatory regions: cluster 1 (upper panel) (Anova p value = 1.91e−07) and cluster 2 (lower panel) (Anova p value < 2e−16). PostHocTest significance codes:*p < 0.05; **p < 0.01; ***p < 0.001. (c,d) Gene Ontology terms enriched for the target genes of cluster 1 (c) and cluster 2 (d). The dotplot was generated using “clusterProfiler” R/Bioconductor package. Dot sizes indicating gene counts of specific terms.

