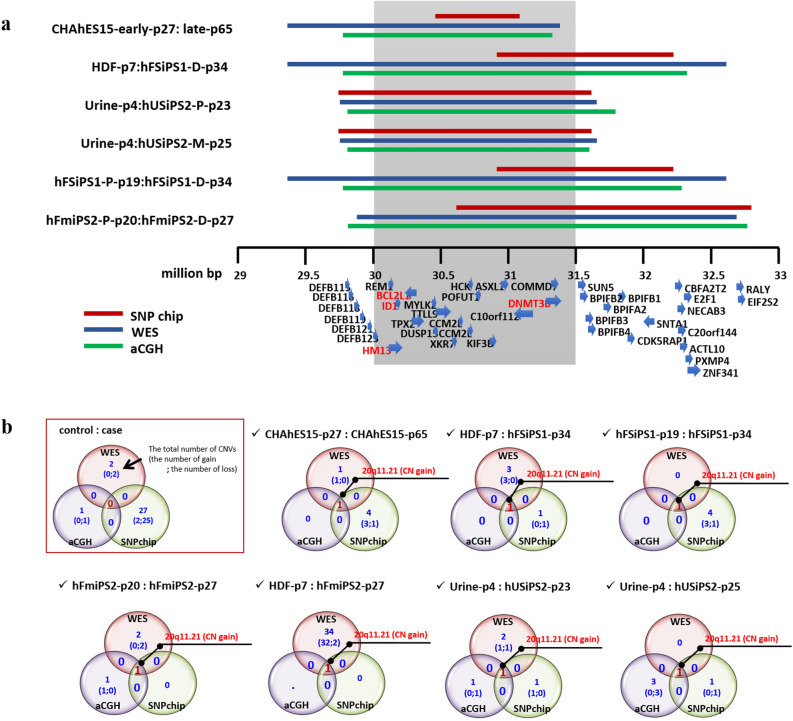
Figure 1.
Details of the region of recurrent CNV gain at 20q11.21 with WES, SNP array, and aCGH analyses. (a) Details of the region of recurrent CNV gain at 20q11.21. Red, blue, and green bars indicate the breakpoint of the CNV gain at 20q11.21 using SNP array, WES, and aCGH analysis, respectively. The core range, including the candidate BCL2L1, ID1, DNMT3B, and HM13 genes with strong selective advantages, is shaded in grey. This analysis was performed for control-case paired samples, showing the control: case cell lines on the left. The genes in the region of the CNV gain are specified with strand directions at the bottom. (b) Venn diagrams illustrating CNVs for paired samples from three platforms. Only pairs with CNV gain at 20q11.21 were specified. The CNV results for other paired samples are illustrated in Supplementary Fig. S2. A detailed explanation of the Venn diagrams is given in the red box.

