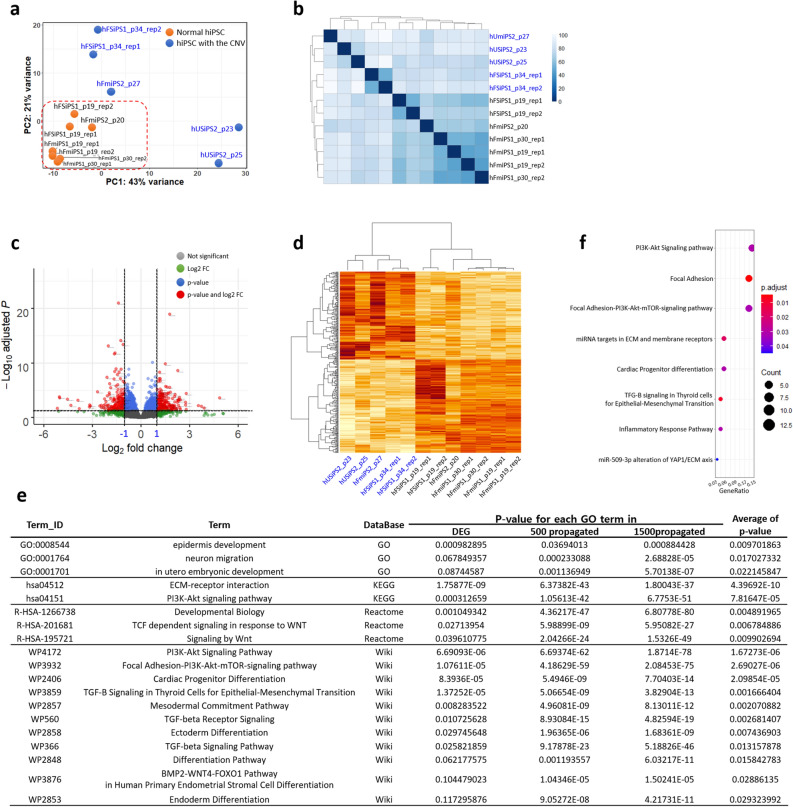
Figure 2.
Transcriptome profiling of hPSCs with CNV gain at 20q11.21. (a) A principal component analysis (PCA) plot for all 12 hiPSC lines from the RNA-seq data dataset is shown. Orange and blue dots indicate normal hiPSCs and hiPSCs with CNV gain, respectively. (b) Sample distance matrix and unsupervised hierarchical clustering for all samples in the expression space. This matrix was constructed with the distance between samples based on normalized expression values based on the “varianceStabilizingTransformation (vst)” method. (c) Scatterplot of the DEGs identified in this study. Significantly up- and downregulated genes are represented by red dots. Normalized count-based analysis was performed for the control and case studies. Grey, green, blue, and red dots indicate “not significant”, genes with |log2FC|≥ 1, genes with p-value > 0.05, and genes with |log2FC|≥ 2 and p-value > 0.05, respectively. (d) Heatmap and unsupervised hierarchical clustering for samples based on only DEG sets. The higher the value of the log2-fold change, the darker the red colour is. (e) Representation of GO results for 169 downregulated genes, 500 propagated genes, and 1500 propagated genes in four different GO databases, DAVID, KEGG, Reactome, and Wikipathways. The average p-value indicates the mean p-value for each GO term derived from DEG, 500 propagated genes, and 1500 propagated genes. A full list of GO results is specified in Supplementary Table S4. (f) Dot plots for significant GSEA terms of down-DEGs. Dot sizes indicate GeneRatio. GeneRatio indicates the gene counts involved in each GSEA term. Adjusted p-values represented in colour gradient ranging from red to blue, corresponding to the- increasing adjusted p-values. hiPSCs with CNV gain are represented in blue. Rep1 and rep2 indicate replicates of RNA-seq for the sample.

