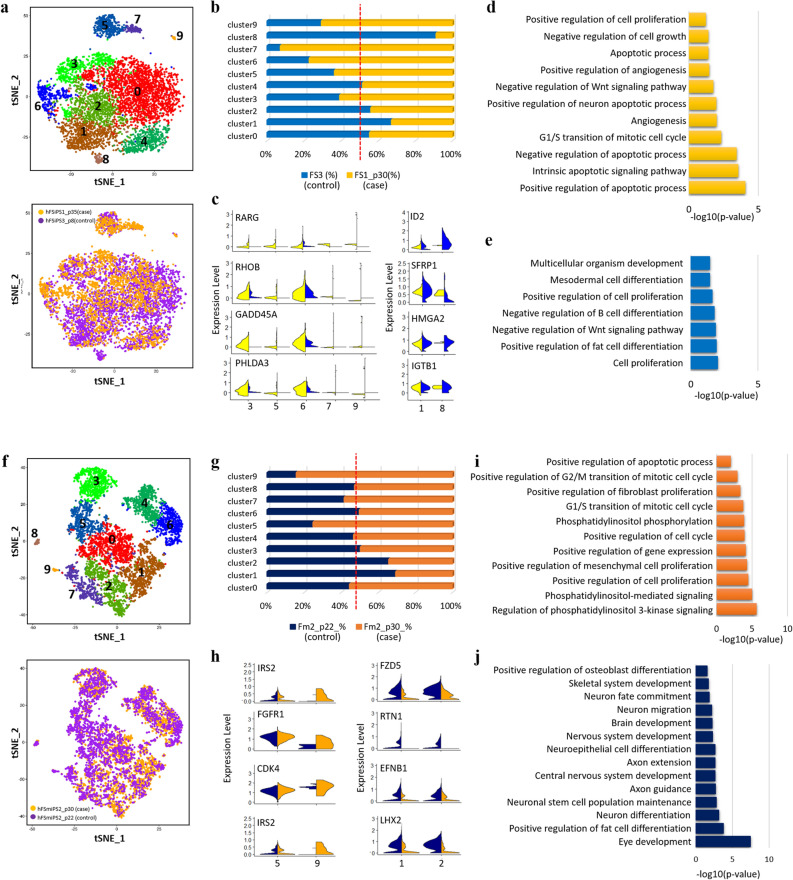
Figure 3.
Transcriptional heterogeneity of EBs derived from hPSCs with CNV gain at 20q11.21. (a) tSNE plot of 6590 cells, coloured by cluster (top) and the sample origin (bottom) for hFSiPS3 (control) and hFSiPS1 (case) lines. (b) Fraction of cells in each cluster for the hFSiPS3 and hFSiPS1 lines. Blue bars indicate the proportion of the number of cells in each cluster of hFSiPS3, and yellow bars indicate those of hFSiPS1. (c) Violin plots showing the expression distribution of selected genes that are detected in higher proportions in hFSiPS1 (left, case) and in hFSiPS3 (right, control). GO results for clusters 3, 5, 6, 7, and 9 are shown in (d), and those for clusters 1 and 8 are shown in (e). (f) tSNE plot for 5850 cells, coloured by cluster (top) and the sample origin (bottom) for hFmiPS2 at p22 (control) and hFmiPS2 at 30 (case) lines. (g) Fraction of cells in each cluster for hFmiPS2 at p22 and p30. Navy bars are indicated as the proportion of the number of cells in each cluster of hFmiPS2 at p22, and orange bars are indicated as those of hFmiPS2 at p30. (h) Violin plots showing the expression distribution of selected genes that are detected in higher proportion in hFmiPS2 at p30 (left, case) and in hFmiPS2 at p22 (right, control). The GO results for clusters 5 and 9 are shown in (i), and those for clusters 1 and 2 are shown in (j).

