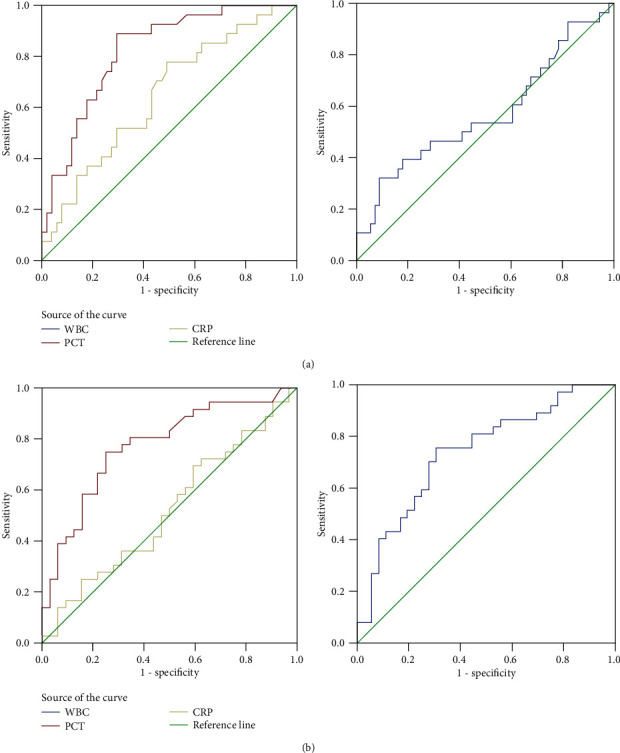
Figure 3.

The ROC curves showing the ability of the PCT, CRP, and WBC to distinguish severe HAdV infection from nonsevere HAdV infection (a). The AUC value of PCT is significantly higher than of both CRP (P = 0.029) and WBC (P = 0.003). The ROC curves showing the ability of the PCT, CRP, and WBC to distinguish HAdV-7 infection from HAdV-3 infection (b). The AUC value of CRP is significantly lower than of both PCT (P = 0.0056) and WBC (P = 0.017). AUC: area under the curve; PCT: procalcitonin; CRP: C-reactive protein; WBC: whole blood cell; HAdV: human adenovirus.
