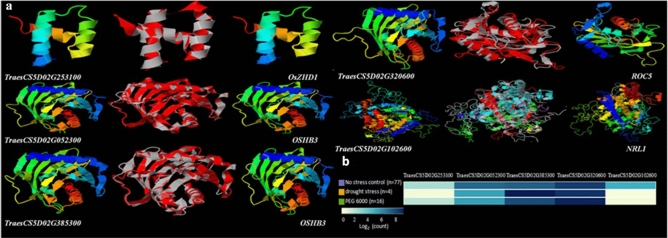
Figure 4.
(a) 3D protein structures of the predicted leaf rolling genes in wheat (left) along with the protein structure of corresponding gene in rice (right) and their superimposed (middle) 3D structure in red and grey color. Red color represents wheat protein whereas grey represents rice protein. (b) Expression profiles of predicted leaf rolling wheat genes in three different conditions (no stress control, drought stress and PEG 6000). The dark and light intensity of the blue color represents the higher and lower relative abundance of the transcript.

