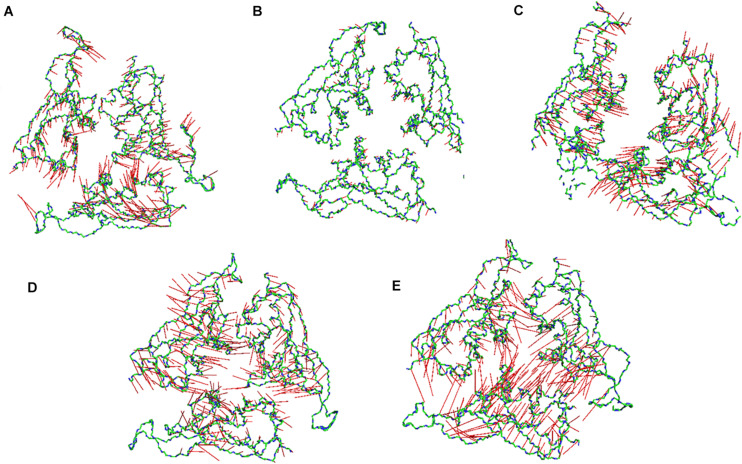
FIGURE 6.
Porcupine plots of the RBD of SARS-CoV-2 Spike protein. Porcupine plots generated from the extreme conformations of the RBD of the Spike protein at (A) 10°C, (B) 20°C, (C) 30°C, (D) 40°C, and (E) 50°C showing difference in dynamics of the protein at different temperature. The arrows are colored in red and the protein backbone is shown as sticks colored by CPK. More arrows are pointed toward the protein core at 40 and 50°C implying a closed conformation.

