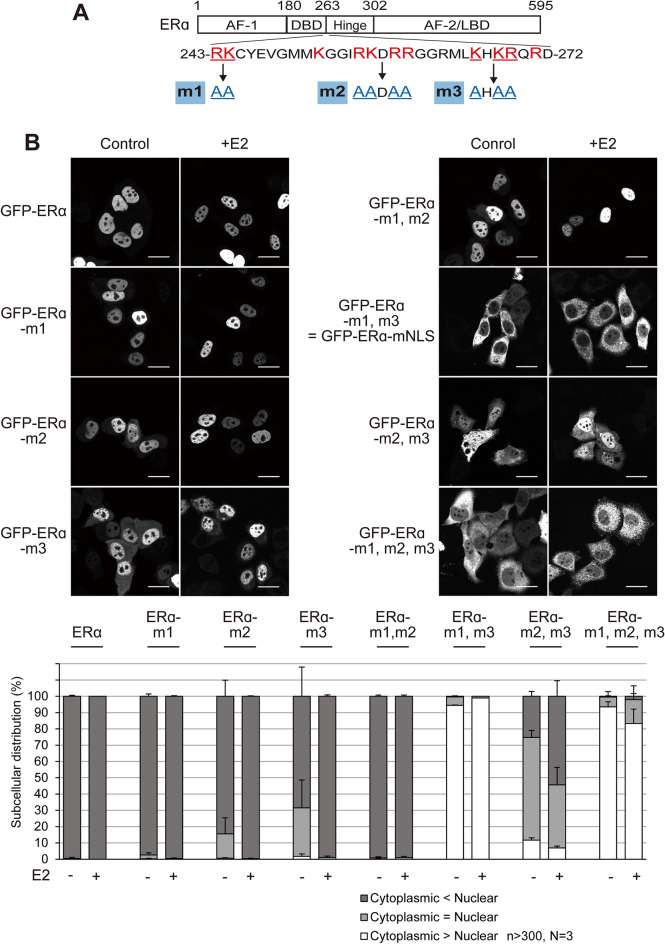
Figure 1.
The subcellular distribution of GFP-ERα and the point mutants. (A) Schematic representation of the ERα mutants. The diagram shows the full-length ERα, and the positions of the DNA-binding domain (DBD), hinge region, ligand-binding domain (LBD), and the weak constitutive activation function (AF-1), and hormone-dependent activation function (AF-2) are indicated. The NLS straddles the DBD and hinge region. (B) Fluorescence images of GFP-ERα and the point mutants in HeLa cells, in the presence or absence of 10 nM E2 for 3 h. Scale bars, 20 µm. The subcellular distribution (%) of GFP-ERα and the point mutants was determined from the nuclear, nuclear and cytoplasmic, and cytoplasmic distribution, calculated from > 300 transfected cells. Each data point represents the average of three independent experiments and the error bars denote the standard deviation.

