Figure 3.
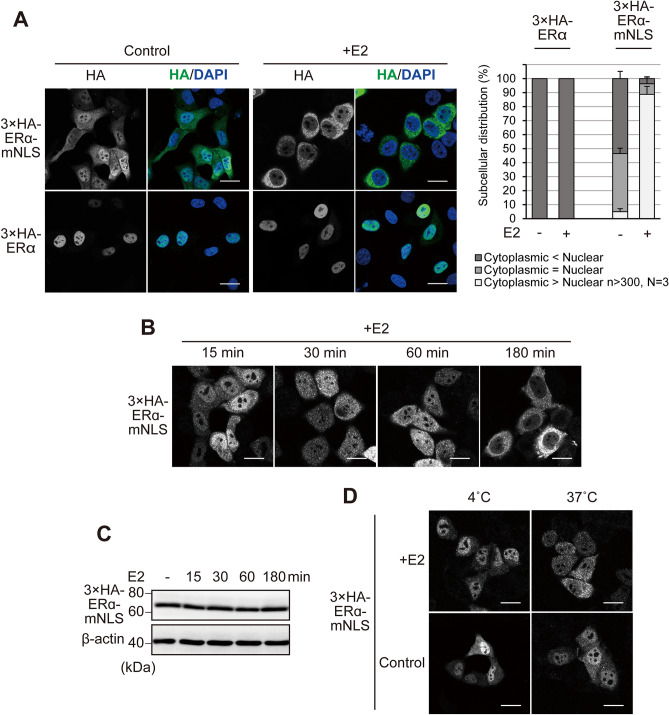
E2 induces cytoplasmic localisation of ERα-mNLS. (A) Immunofluorescence images of 3 × HA-ERα and 3 × HA-ERα-mNLS in HeLa cells, in the presence or absence of 10 nM E2 for 3 h. The cells were immunostained for HA (green) and stained with DAPI (blue). Scale bars, 20 µm. The subcellular distribution (%) of GFP-ERα and the point mutants was determined from the nuclear, nuclear and cytoplasmic, and cytoplasmic distribution, calculated from > 300 transfected cells. Each data point represents the average of three independent experiments and the error bars denote the standard deviation. (B) Immunofluorescence images of 3 × HA-ERα-mNLS in HeLa cells treated with 10 nM E2 for the indicated durations. The cells were immunostained for HA. Scale bars, 20 µm. (C) Treatment with E2 did not affect the steady-state expression levels of 3 × HA-ERα-mNLS. HeLa cells expressing 3 × HA-ERα-mNLS were treated with 10 nM E2 for the indicated durations. Following treatment, the cells were lysed and subjected to SDS-PAGE. Western blotting was performed with an anti-HA antibody. β-actin was used as the loading control. Full-length images of western blots are shown in Supplementary Fig. 10. (D) The nuclear export of 3 × HA-ERα-mNLS was inhibited at a lower temperature. HeLa cells expressing 3 × HA-ERα-mNLS were treated with 10 nM E2 and incubated at 4 °C or 37 °C for 1 h and were immunostained for HA. Scale bars, 20 µm.

