Figure 4.
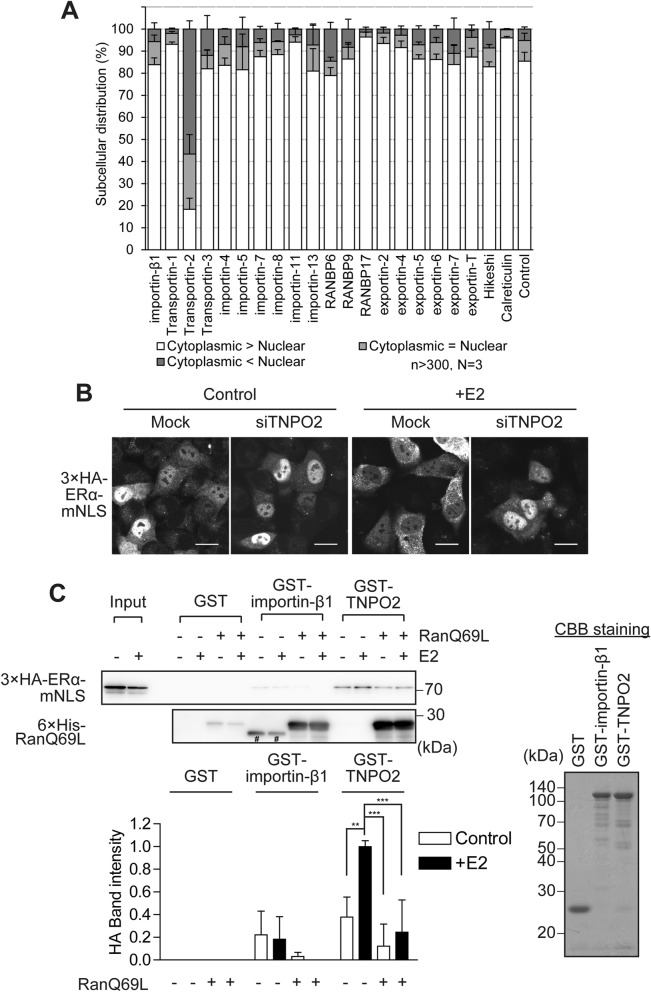
TNPO2 is necessary for the E2-induced cytoplasmic localisation of ERα-mNLS, but does not function as a nuclear export receptor. (A) The effect of knockdown of the importin-β family, calreticulin, or hikeshi on the subcellular distribution of 3 × HA-ERα-mNLS. HeLa cells were transfected with siRNAs against the importin-β family, hikeshi, and calreticulin. The next day, the cells were transfected with plasmids expressing 3 × HA-ERα-mNLS. The cells were subsequently treated with 10 nM E2 for 2 h and immunostained for HA. The subcellular distribution (%) of 3 × HA-ERα-mNLS was determined from the nuclear, nuclear and cytoplasmic, and cytoplasmic distribution, calculated from > 300 transfected cells. Each data point represents the average of results obtained from three independent experiments and the error bars denote the standard deviation. (B) Immunofluorescence images of 3 × HA-ERα-mNLS in HeLa cells transfected with TNPO2-specific siRNAs, in the presence or absence of 10 nM E2 for 2 h. The cells were immunostained for HA. Scale bars, 20 µm. (C) TNPO2 recognises 3 × HA-ERα-mNLS in an E2-dependent and RanGTP-sensitive manner. GST pulldown assays were performed with recombinant GST, GST-importin-β1 and GST-TNPO2, using HeLa lysates expressing 3 × HA-ERα-mNLS, in the presence or absence of 2 µM recombinant 6 × His-RanQ69L. GST-importin-β1 was used as the negative control. #, non-specific band. CBB stain was used as the loading control for the reaction. The average band intensity of 3 × HA-ERα-mNLS bound to GST-TNPO2 in the presence of E2 was set to 1. Each data point represents the average of four independent experiments and the error bars denote the standard deviation. **P < 0.01, ***P < 0.001 as determined by one-way ANOVA followed by Tukey’s multiple comparison test. Full-length images of western blots and CBB staining are shown in Supplementary Fig. 11.

