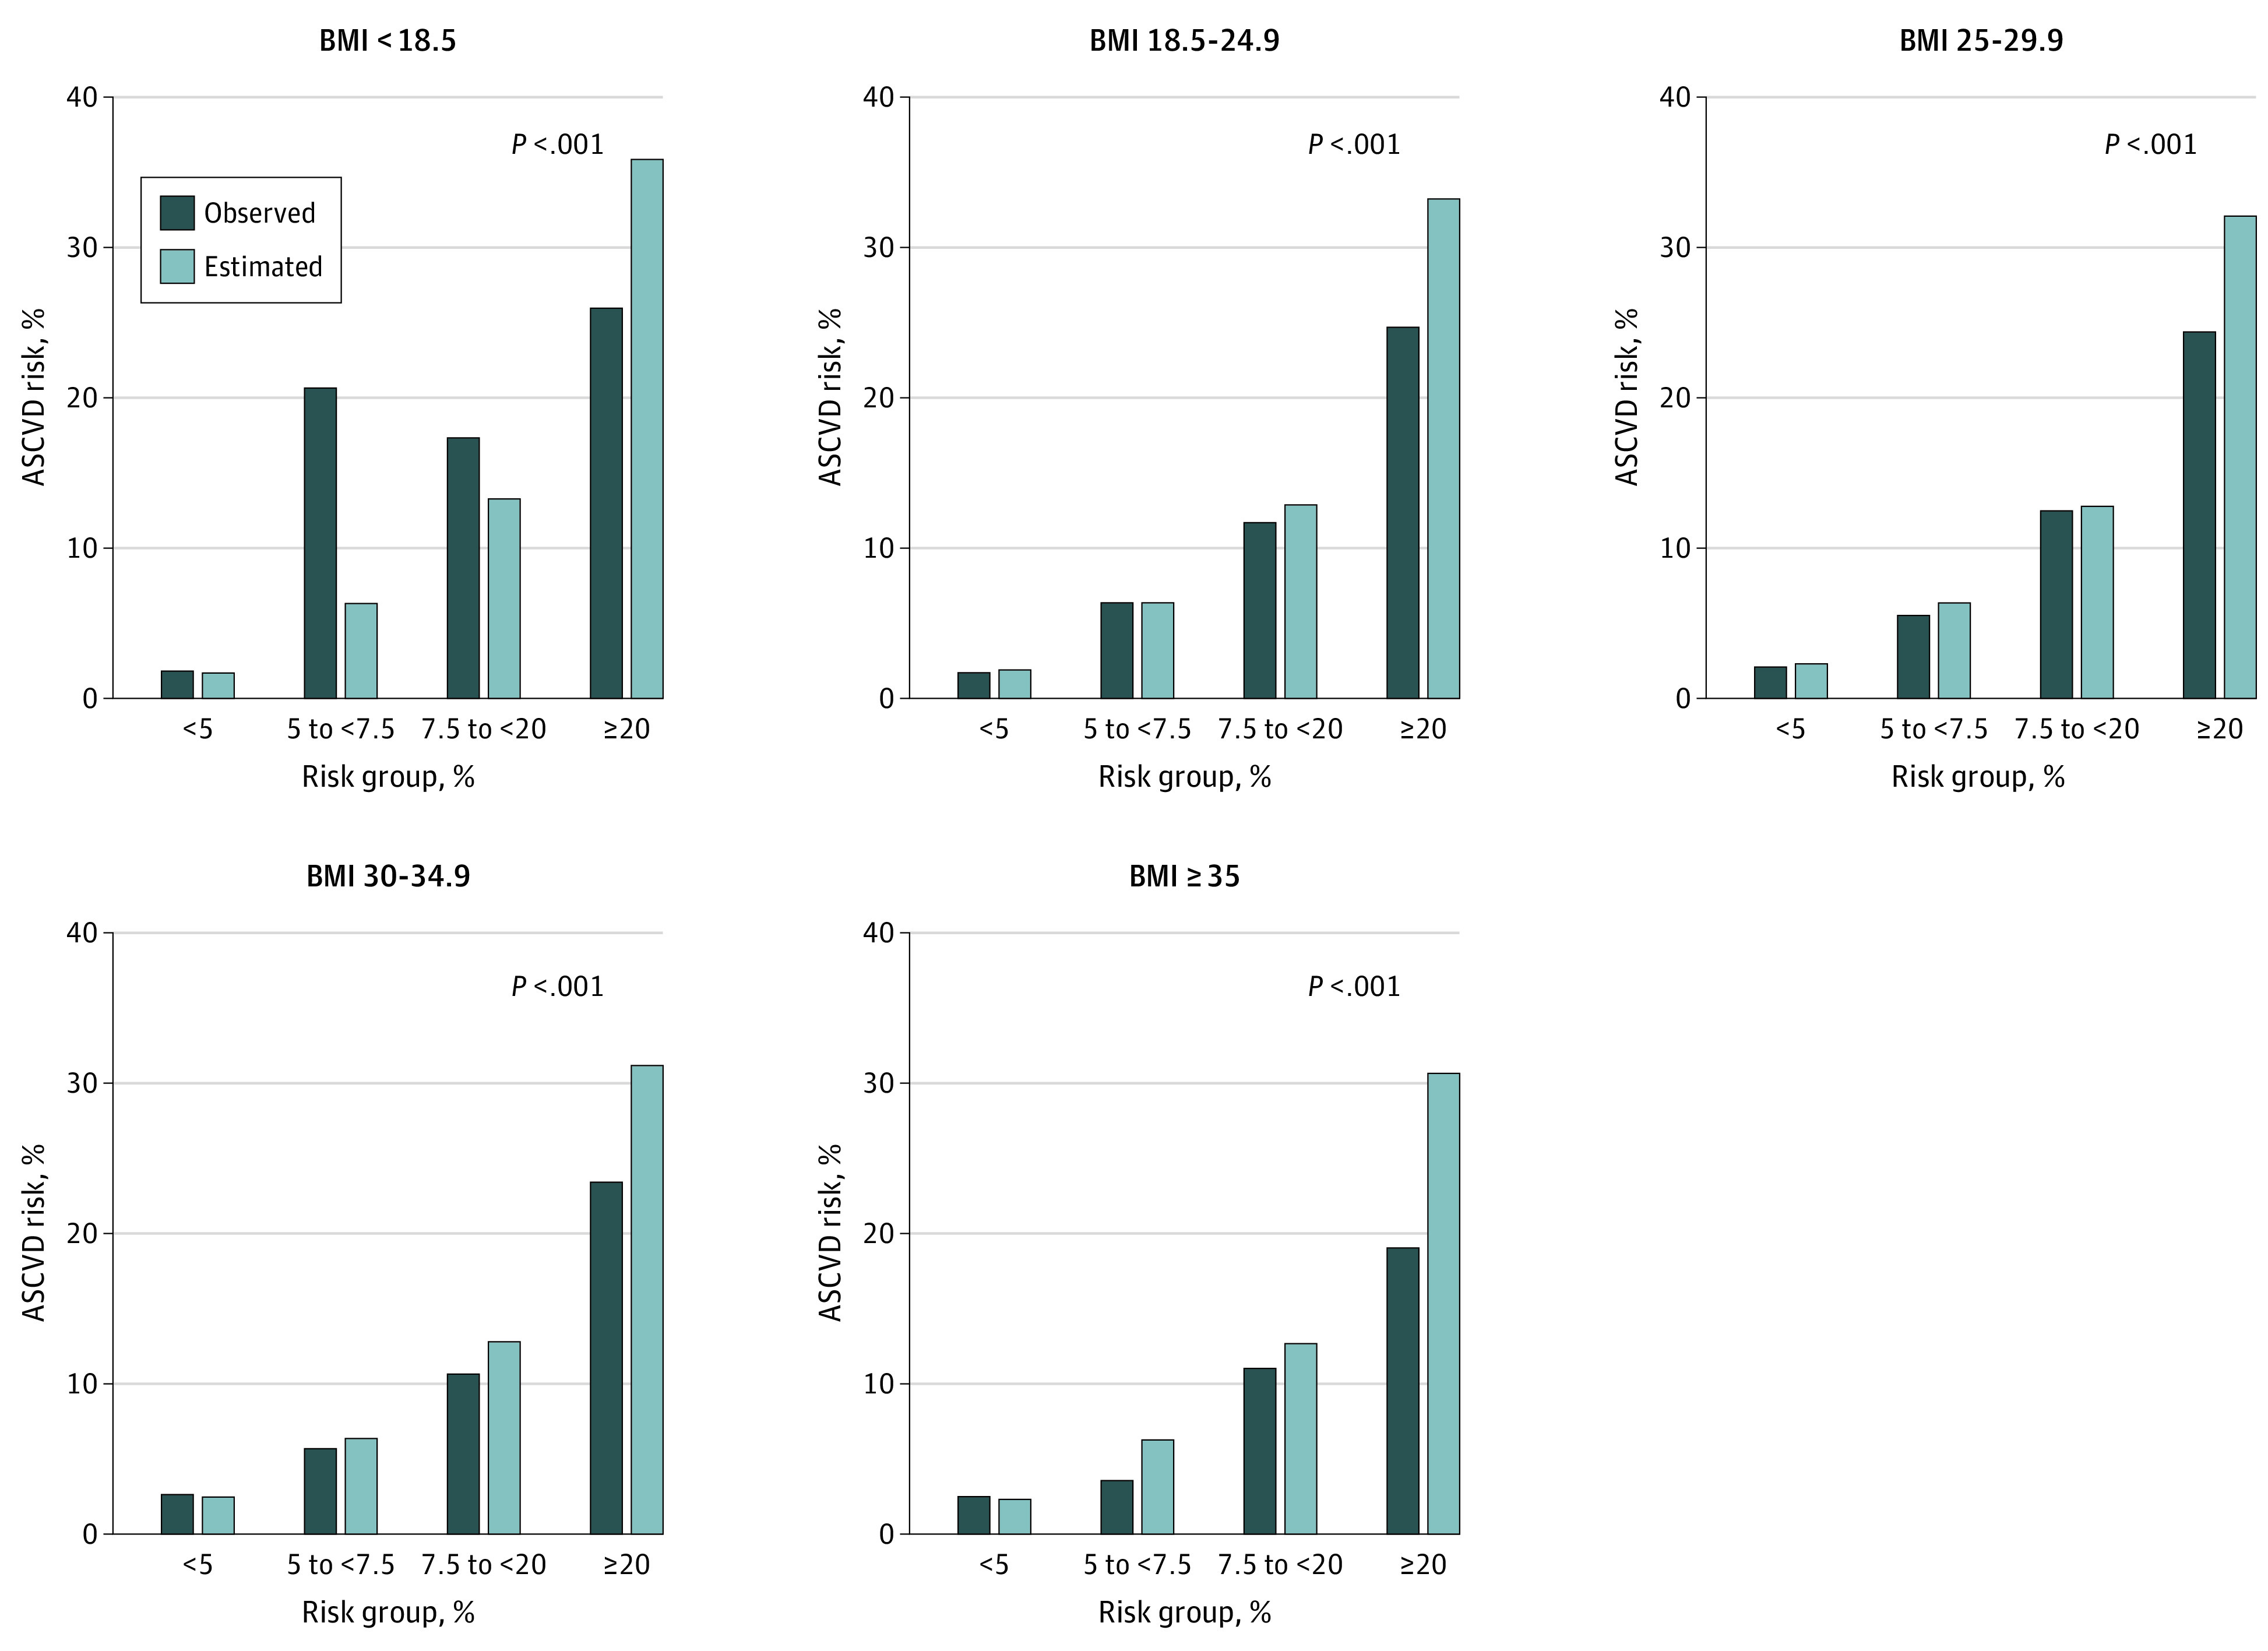
Figure. Calibration by Body Mass Index (BMI) Category.

Rates of events estimated by the pooled cohort equations compared with rates of events observed in the study, across subgroups based on estimated risk, by BMI category. P values are for Nam-D'Agostino χ2 goodness-of-fit test; a nonsignificant χ2 (P > .05) indicates good calibration. ASCVD indicates atherosclerotic cardiovascular disease. BMI calculated as weight in kilograms divided by height in meters squared.
