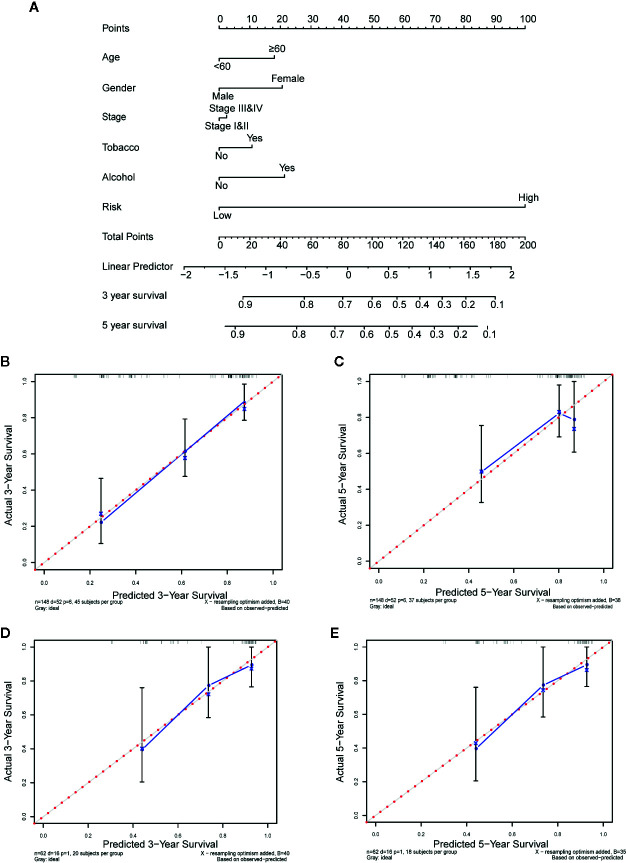
Figure 8.
Nomogram to predict the 3-, and 5-year survival probability of oral squamous cell carcinoma (OSCC) patients. (A) Prognostic nomogram for predicting overall survival (OS) of OSCC patients based on The Cancer Genome Atlas (TCGA) training set. (B, C) The calibration plots for predicting 3-year (B) and 5-year survival (C) in training set. (D, E) The calibration plots for predicting 3-year (D) and 5-year survival (E) in testing set. Nomogram-predicted survival and actual survival were plotted on the x-axis and y-axis, respectively. The red dotted line represents the best prediction and the blue solid line represents the nomogram-prediction. The vertical bars represent a 95% confidence interval.

