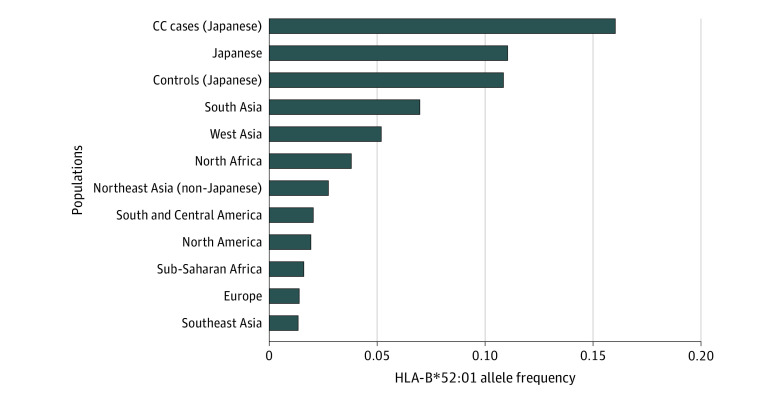
Figure 2. HLA-B*51:01 Allele Frequency Spectra in Worldwide Populations.
Mean HLA-B*52:01 allele frequencies among each population is plotted in the bar-plot. HLA allele frequency data were obtained from Allele Frequency Net Database (eAppendix in the Supplement). Cervical cancer (CC) cases (Japanese) represents the CC case population enrolled in the current study.

