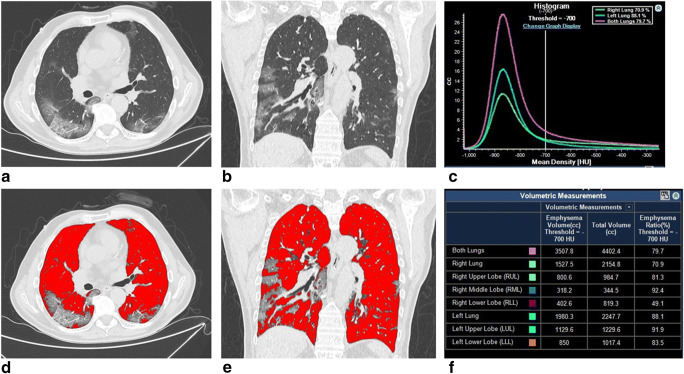
Fig. 3.
A 61-year-old man with SARS-CoV-2-related pneumonia. CT images in axial (a) and coronal (b) planes, with window width and level for the evaluation of the lung parenchyma. The images show the presence of bilateral ground-glass opacities and partial crazy-paving pattern. Final CT score: 12. Post-processed CT images in axial (d) and coronal (e) sections showing low attenuation areas based on thresholds of − 700 HU that correspond to ventilated lung volume (VLV). CT density histogram based on the attenuation lung analysis showing both long volumes that correspond to TLV (purple line), left (blue line), and right (green line) lung volumes (c). Post-processing volumes of different lung segments calculated by the software (f)

