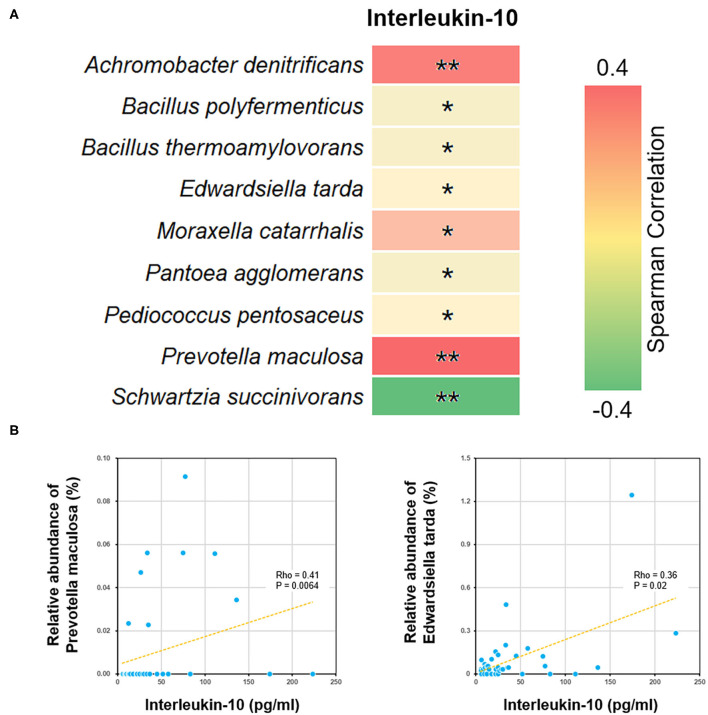
Figure 5.
Correlations between bacterial species and blood interleukin-10 level. (A) The heat map showed all the species with significant Spearman correlation coefficients in the ALL group. *P < 0.05; **P < 0.01. (B) The scatter plots showing IL-10 level and the relative abundance of Edwardsiella tarda and Prevotella maculosa.

