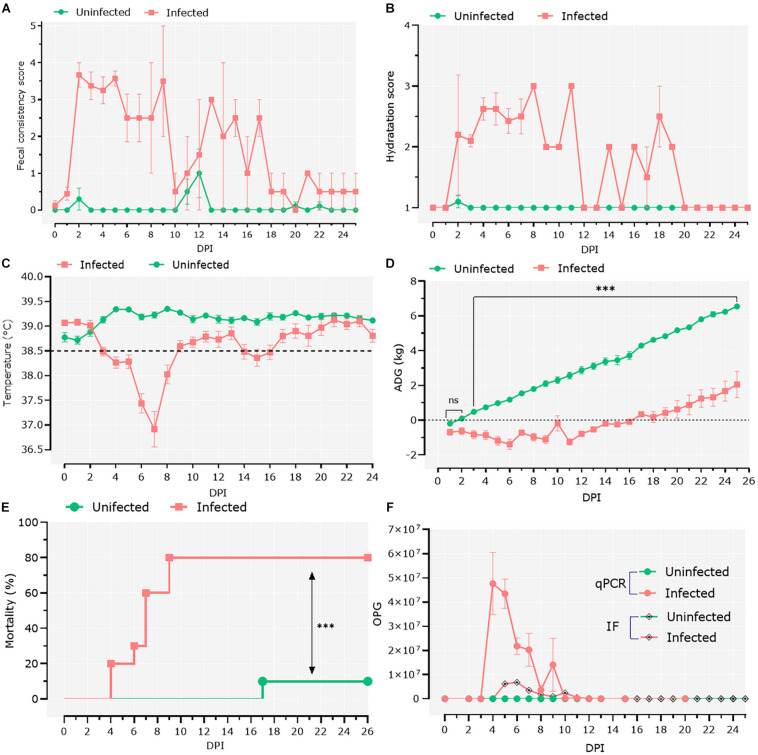
FIGURE 1.
Clinical follow-up of animals. (A) Daily average fecal consistency score. The fecal consistency score was recorded from 0 to 4 as either: normal saddle, without mucus (0), pasty and thick, molded or not, glairy (1), creamy (2), semi-fluid (3), and liquid (4). (B) Daily average dehydration scores were recorded as normal (1), mildly dehydrated (2), and severely dehydrated (3). (C) Daily average central temperature. The orange line indicates the limit from which we consider animals in hypothermia. (D) Average daily weight gain (ADG). Data of ADG were explored using general linear mixed-effects model, including infection, time, and their interaction as fixed effects. The significant effect of the time–infection interaction is indicated (ns, non-significant; ∗∗∗p < 0.001). (E) Mortality rates were compared using Mantel–Cox χ2-based test; ∗∗∗P < 0.001. (F) Parasitic load was detected by direct immunofluorescence assay and quantitative PCR. The parasitic load was expressed as the mean of oocysts per gram of feces ± standard deviation.

