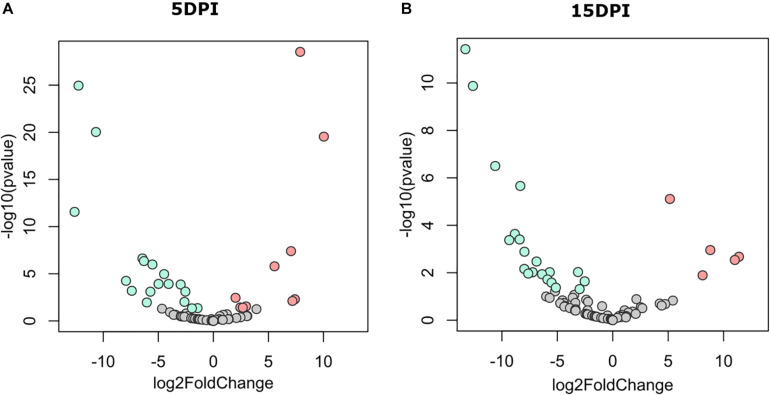
FIGURE 3.
Differential abundant taxa between fecal microbiota of goat kids, from groups uninfected and infected with Cryptosporidium parvum. Volcano plot showing differential abundant taxa (green = uninfected, red = infected, gray = non-significant) identified by DESeq2 analysis. Taxa and ranked by log fold-change and the negative log-10 transform of the nominal P-value (P < 0.05). Comparisons were performed at (A) 5 dpi and (B) 15 dpi. Detailed information on taxa identity and differentiation is presented in Supplementary Table 1.

