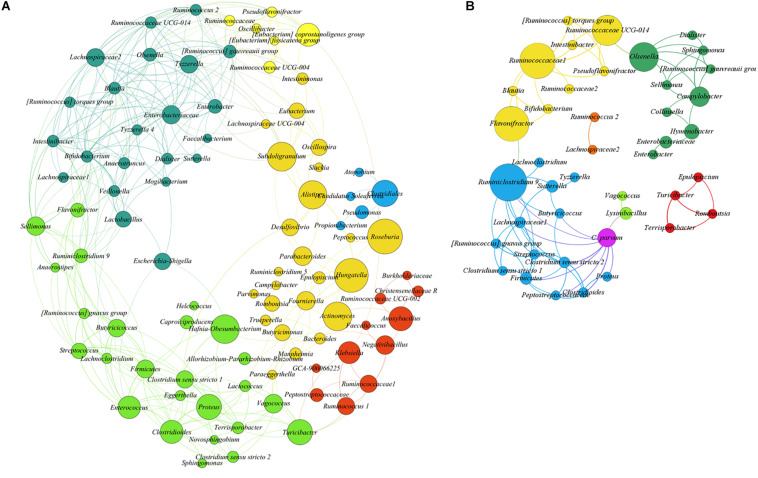
FIGURE 4.
SparCC correlation networks observed between taxa, obtained from bacterial and archaeal 16S rRNA gene sequences. Nodes correspond to taxa at the genus level, and connecting edges indicate positive correlations larger than 0.50 (only nodes with at least one significant correlation are represented). (A) Co-occurrence network using all samples from uninfected goat kids. (B) Co-occurrence network using all samples from the infected animals, including Cryptosporidium parvum infection levels as a node (oocysts per gram of feces quantified by qPCR). Node colors are random, but those with the same color indicate taxa modules (communities) that co-occur more frequently than with other taxa. The circle size is proportional to the betweenness centrality of each taxon in the resulting network.

